| |

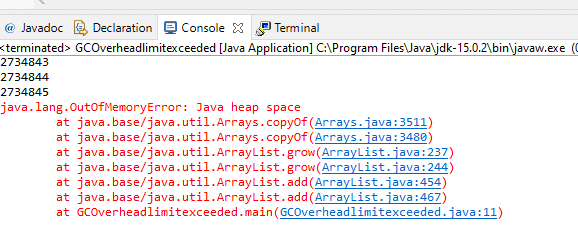
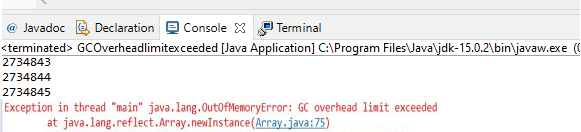
GC Overhead Limit ExceededWhen the Java application spends more than usual time in Garbage Collection, then JVM throws "gc overhead limit exceeded" error. Here GC refers to the 'Garbage Collection'. But there is no need to worry about it because the error can be solved out quickly by just following some points. In this section, we will discuss the points through which we can solve this error. We will also understand why this error is thrown by the JVM. We will try to understand the error with the help of an example. What is the "gc overhead limit exceeded" errorThe complete error that is shown by the JVM is "java.lang.OutOfMemoryError: gc overhead limit exceeded," and the error is thrown when the Java application spends 98% of its time in Garbage Collection. When this happens, JVM signals the user that the application you are executing is taking 98% in Garbage collection; thus less than 2% of the total remains for the heap recovery. The JRE has a built-in Garbage Collection, and the Java feature enables the user to allocate memory for the Java application, and when some space in the memory is no longer used, then GC clears out the memory for them. Thus, GC Overhead limit Exceeded error belongs to java.lang.OutOf MemoryError, and that indicates memory exhaustion. Why "gc overhead limit exceeded" error is thrownAs discussed above that this error belongs to the OutOfMemory error, and that indicates that resource utilization is exhausting and only a little heap space is reclaimed. As per the Java docs also, it can be read that the Java Virtual machine is by default allowed to throw this error if it found that the Java process is spending approximately 98% of the total time in doing GC and repeating the same for the last 5 consecutive garbage collections then such error is thrown. Due to this, the application became too slow to respond as the CPU is busy with Garbage Collection, and other tasks or operations are left in the queue. This error is mainly thrown because the application is able to fit very bare live data into the heap as too insufficient space left for the new allocations. Practical ImplementationTo understand the concept, practical implementation is a great option to explain. Let's discover an example where we have created a class GCOverheadlimitexceeded that defines an ArrayList and added new GCOverheadexceeded () in the list under an unterminated loop, as you can see below: The code snippet is also shown below: 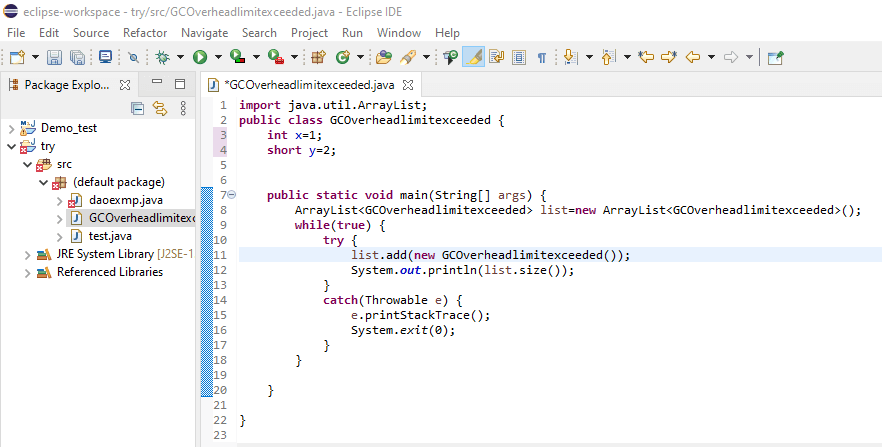
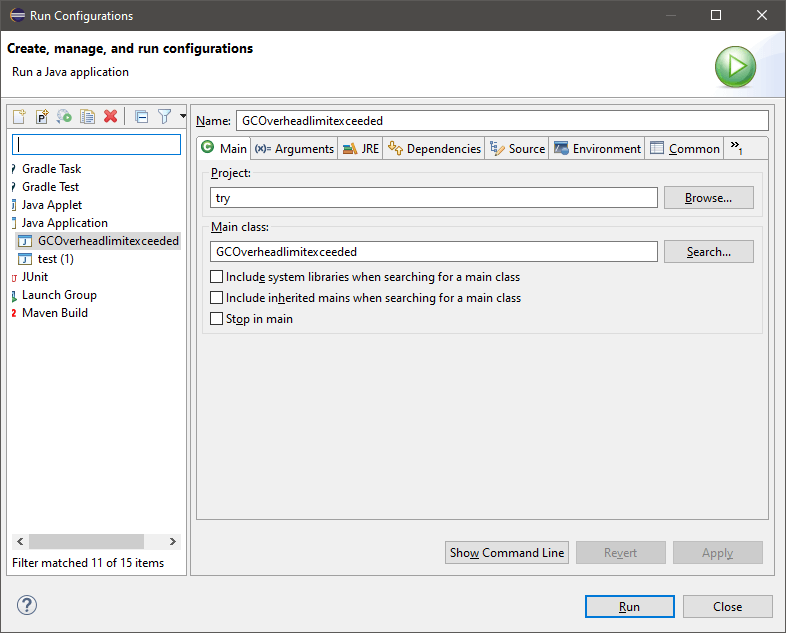
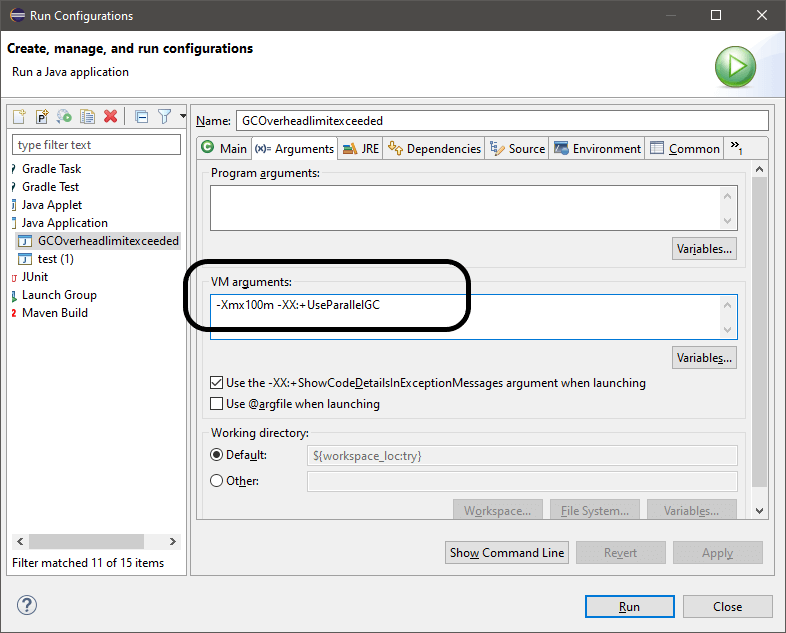
To execute the above code, follow the steps:
Causes of GC overhead limit exceeded errorThere are the following possible causes due to which the gc overhead limit exceeded error is thrown by the JVM at a sudden start: Cause 1: It is possible that there is memory leakage by our Java application. Cause 2: If we have manipulated the code and that may require more memory and tend to store more objects in the memory, it prevents the GC from freeing out the heap memory. In order to verify both the causes, we need to check out the following things:
Note: One should know that in order to avoid resource exhaustion, make use of bounded cache because it bounds a memory limit, but in the unbounded cache, it may run out of memory.Fixing the GC overhead limit exceeded errorIn order to solve and fix the gc overhead limit exceeded error for a given code, one needs to clear out the following questions:
In order to know the answer to these questions, one can make use of the JConsole, which is an automated graphic tool through which we can detect the performance problems arising in our code, and that includes java.lang.OutOfMemory Errors. Jconsole tool is already available in the Java Development Kit. Other than the in-built tool, there are other memory profiling tools such as Visual VM and Eclipse MAT that can be downloaded from the internet. 1) To use the Jconsole monitoring tool, open Windows Command Prompt and type Jconsole command as shown in the below snippet: 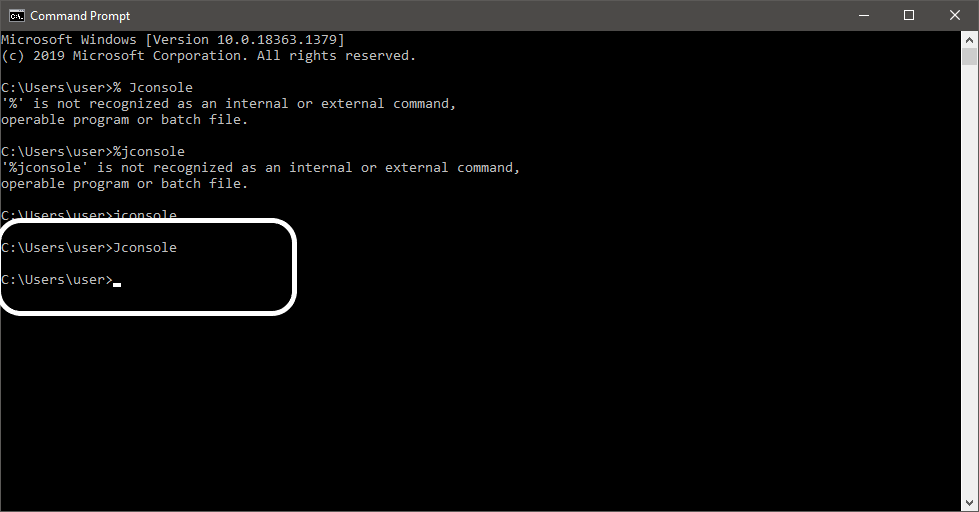
2) If it is available, the Java Monitoring & Management Console will open up, as you can see below: 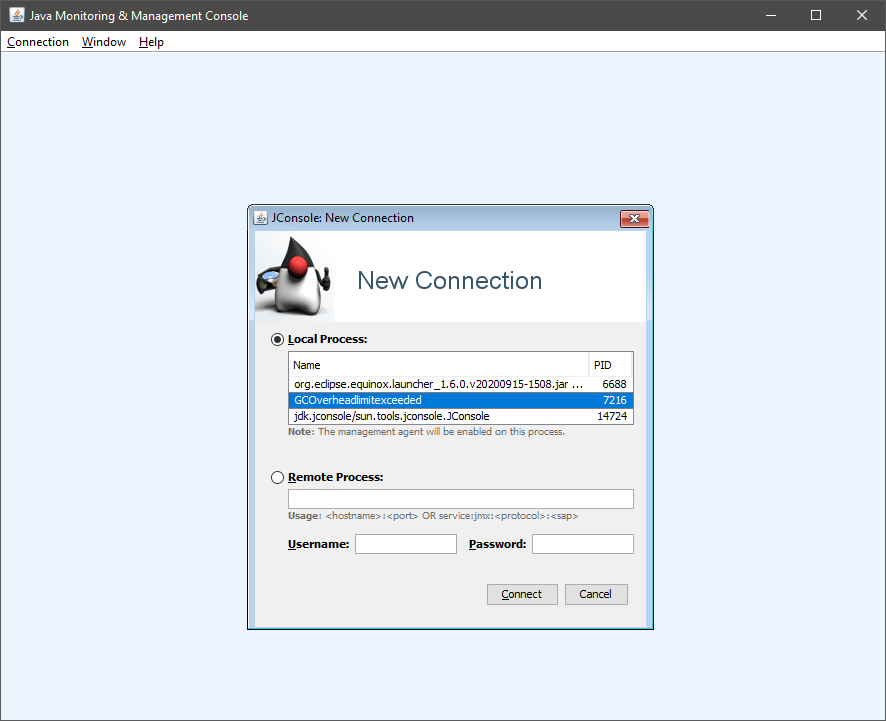
3) You have two ways for using Jconsole for monitoring either by selecting the Java program name from the Local Process or if you know the <hostname> & <port> value, you can go for the Remote Process Here, we selected the Local Process option as the name of our created Java program is visible in the Local Process list as shown above. Note: If you are unable to see the program name you created, go to the IDE and Run the program and once again type Jconsole in the cmd, and now you will be able to see the program name in the Local Process list.4) Click on Connect. 5) In some cases, a dialog box will open; click on Insecure connection. Else skip this step. A snapshot is shown below: 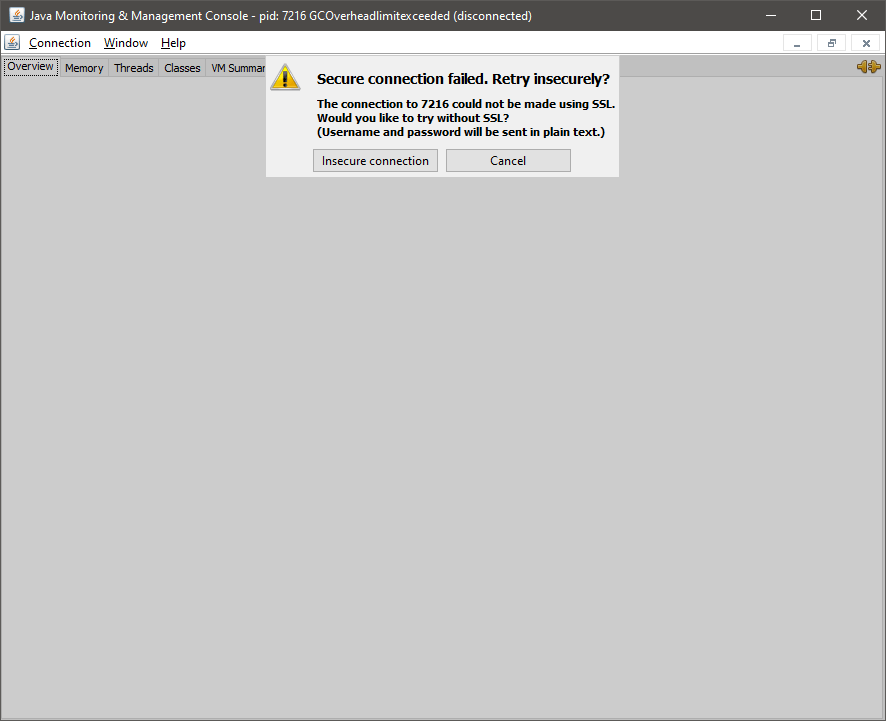
Finally, you will get the Jconsole connection window as we got for our code: 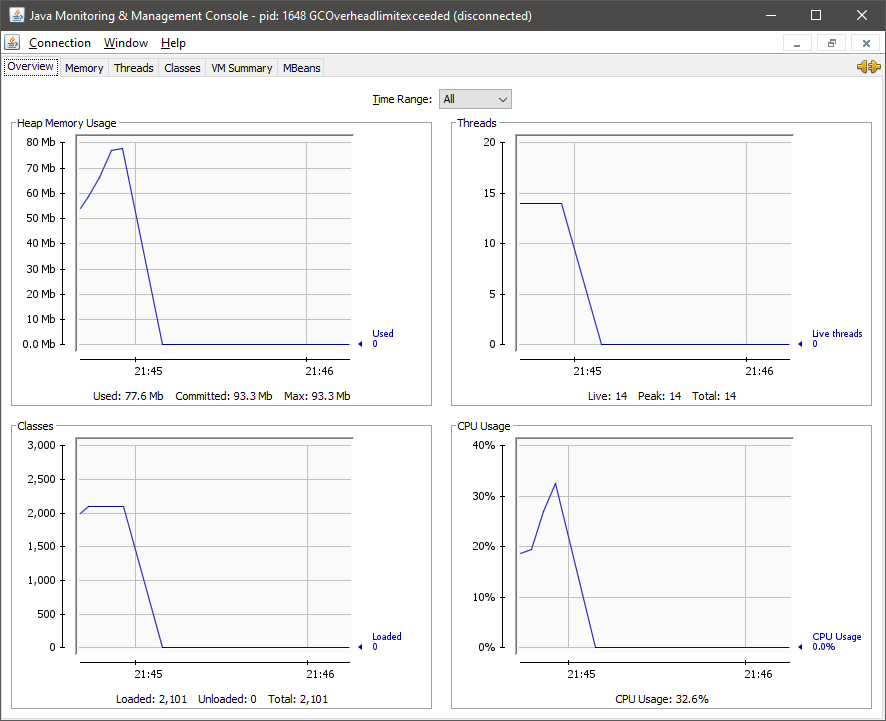
After this, we can understand the memory usage and perform the following tasks:
In order to know the memory leakage for your Java program, click on the Memory tab, and there we can see the memory usage chart as we can see in the below snapshot: 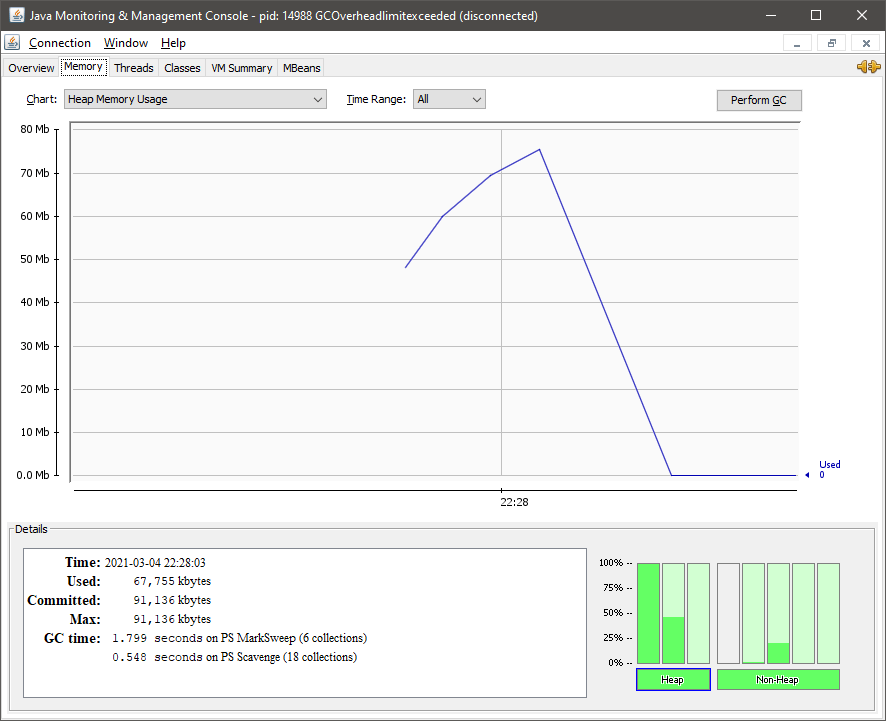
Here, you can see the memory usage by our code, and you can see there was an increment first and then it decreased, and from here, we can analyze the memory usage (heap memory usage) and total time taken, used memory, committed memory and GC time.
Next to the memory tab, the Threads tab is present from where we can analyze the number of threads used in a program, and for our program, we have the following graph: 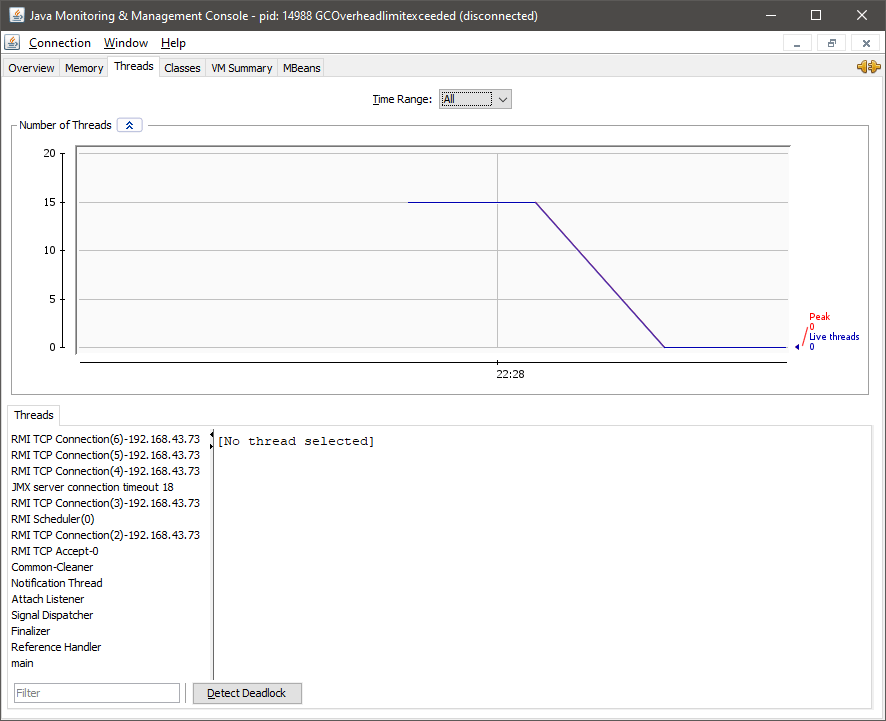
Next to the Threads tab, we have a Classes tab that let us know the classes being created for our program, and here we have the following graph: 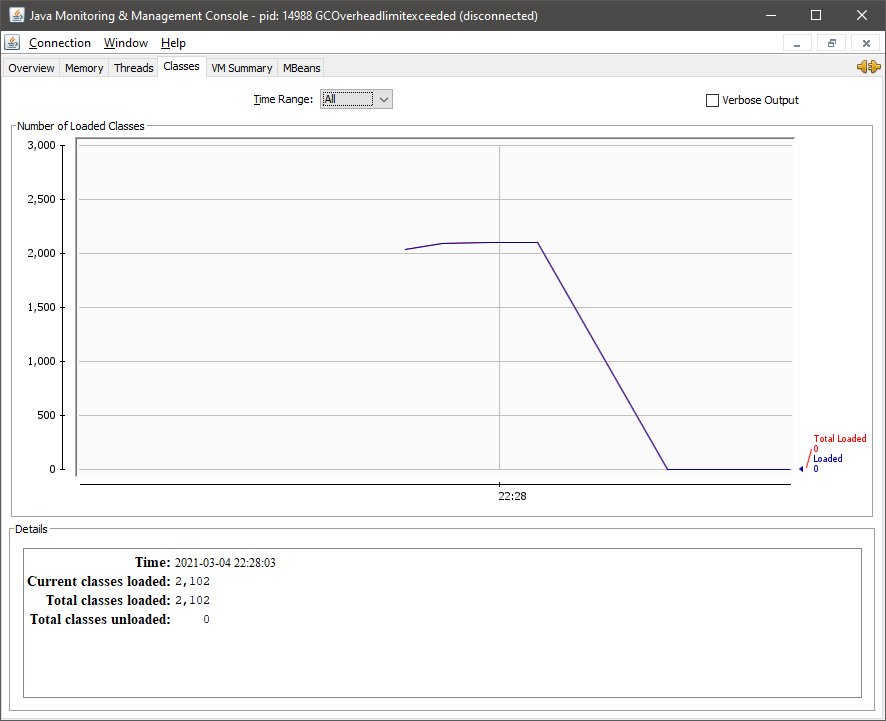
This tab let us know the complete summary of our code, and from here, we can analyze those objects that are occupying the largest part of heap space, as you can see in the below snapshot: 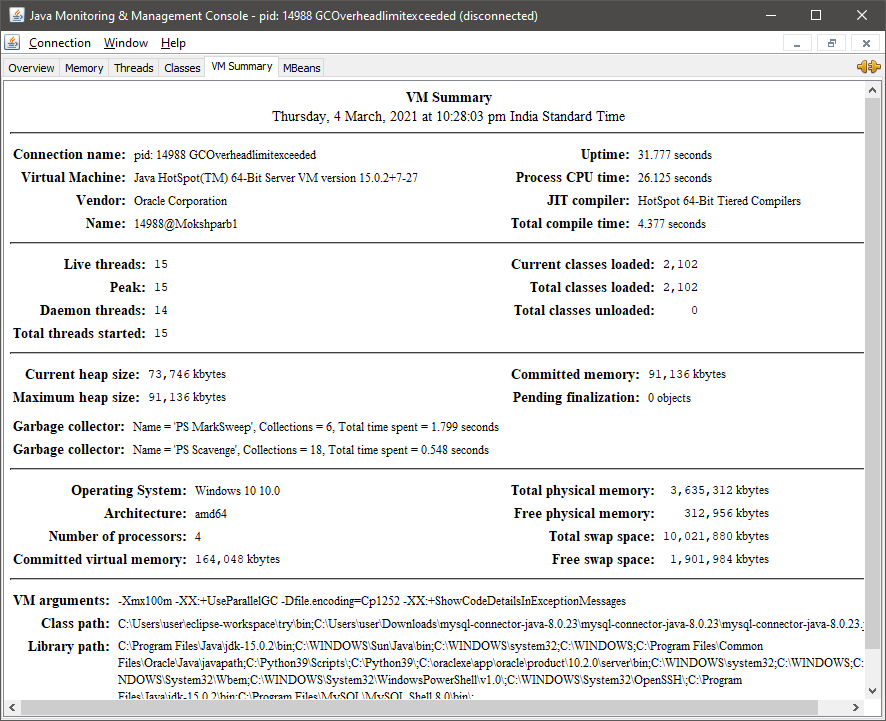
So, using Jconsole or any other monitoring tool can help you determine the cause of GC Overhead limit exceeded error and let you know the objects that are occupying the highest memory and causing such error to be thrown.
Next TopicGenerating QR Code in Java
|
 For Videos Join Our Youtube Channel: Join Now
Feedback
- Send your Feedback to [email protected]
Help Others, Please Share


