IPL Prediction Using Machine Learning Millions of spectators from across the world watch the renowned T20 cricket competition known as the Indian Premier Competition (IPL) in India. There is a real sense of excitement and expectation around each match in the league, which includes some of the top cricket players in the world. With the development of artificial intelligence and machine learning, it is now feasible to anticipate IPL match results more accurately. We will talk about how machine learning can be used to forecast IPL match results in this post. Now we will try to implement Machine Learning to find the model suitable for the prediction of IPL. Importing LibrariesReading The DatasetOutput: 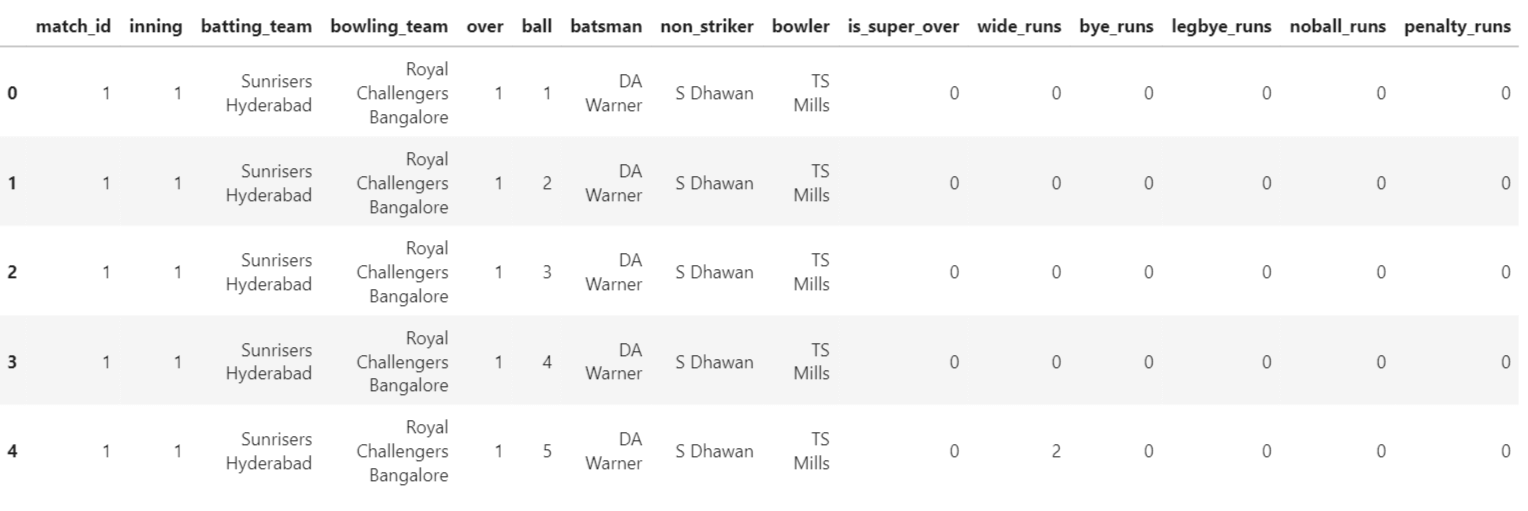 Output: 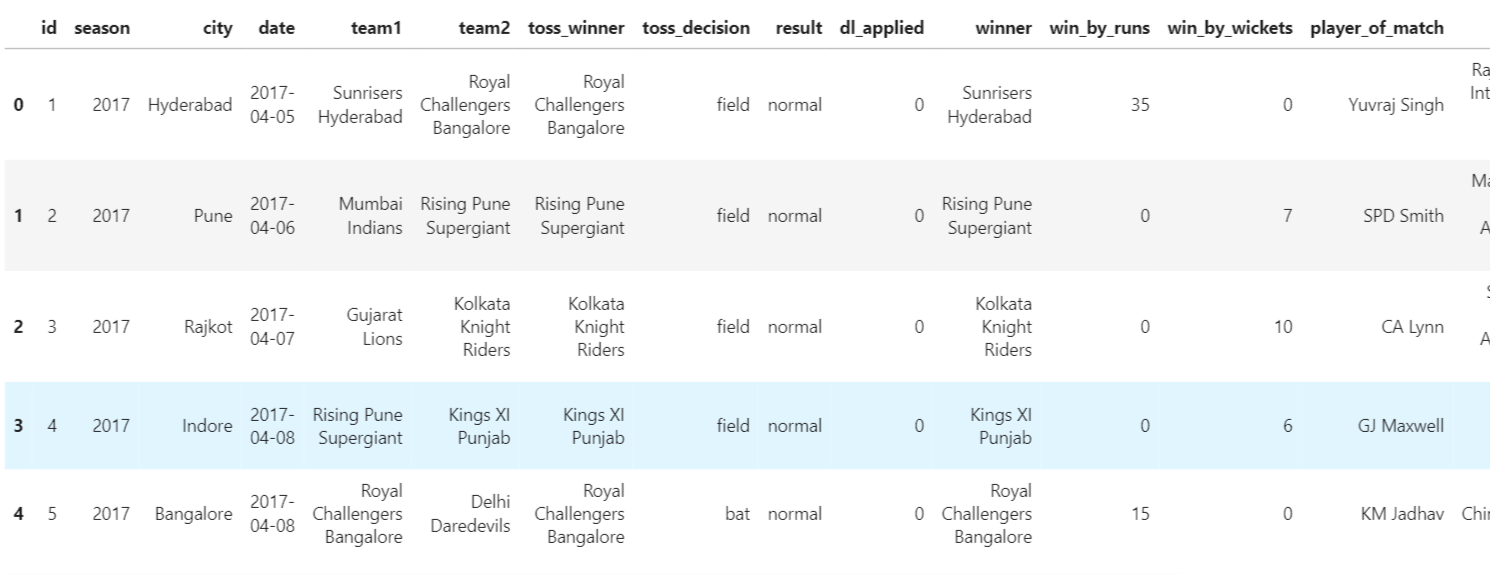 Grouping Batsmen by MatchesHere, we will group the batsman according to their matches played. Output: 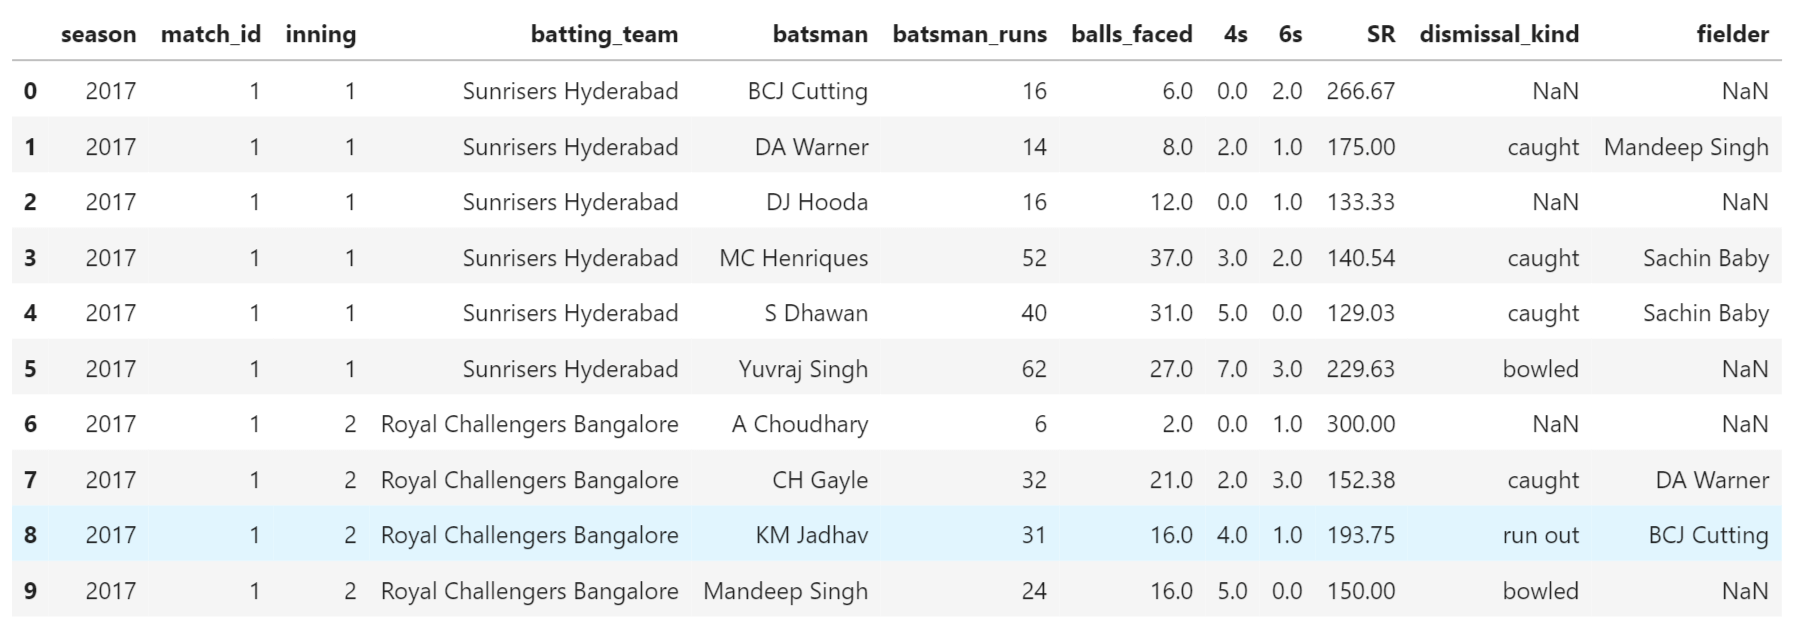 Grouping Bowlers by Set of DataHere, we will group the bowlers. Output: 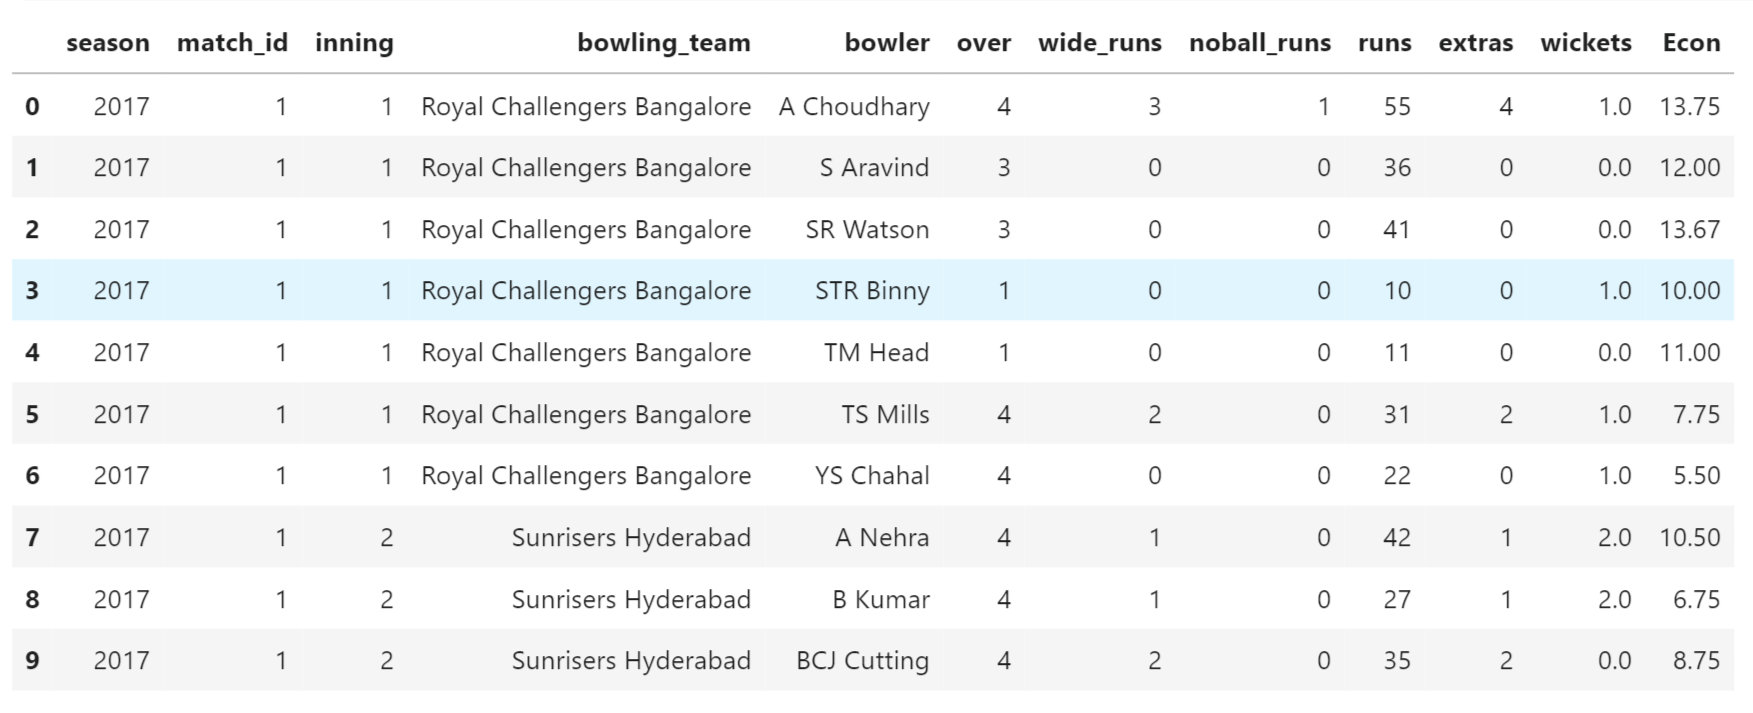 Exploratory Data Analysis(EDA)Here, we will be exploring and analyzing the dataset using various statistical and visualization techniques to uncover patterns, trends, and relationships between the variables. Output: 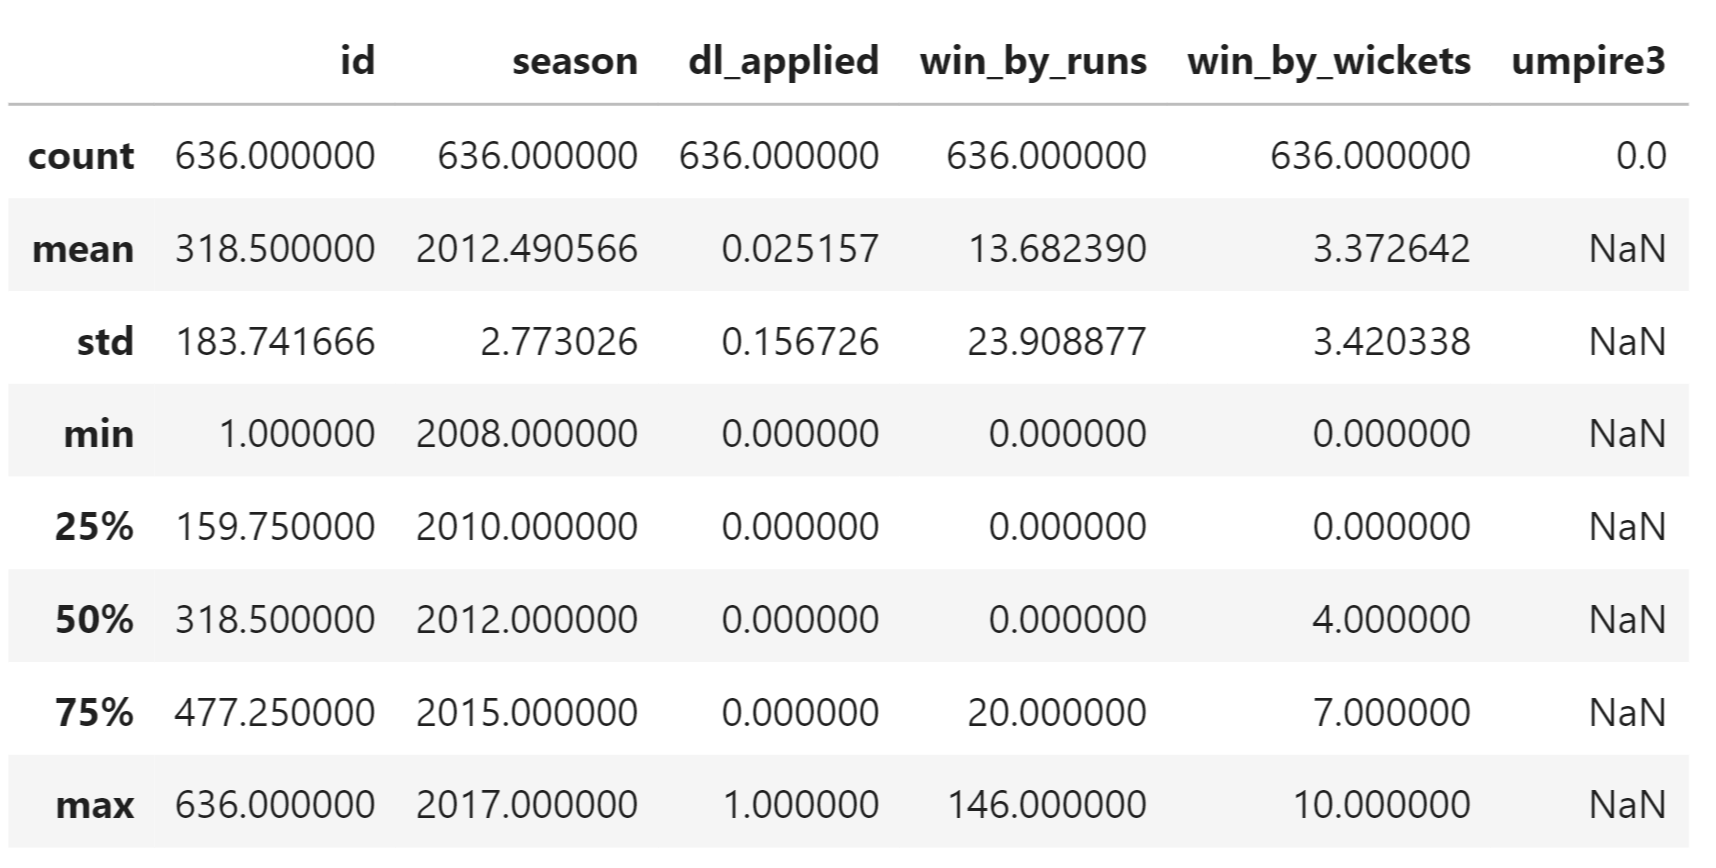 Output:  Output:  Mumbai Indians have won the highest number of toss wins, and in contrast to it, Rising Pune Supergiant has the lowest number of toss wins. Output:  Here, we can say that winning tosses does not make a lot of difference in the game result, but does give you the choice to either bat or bowl first. Output: 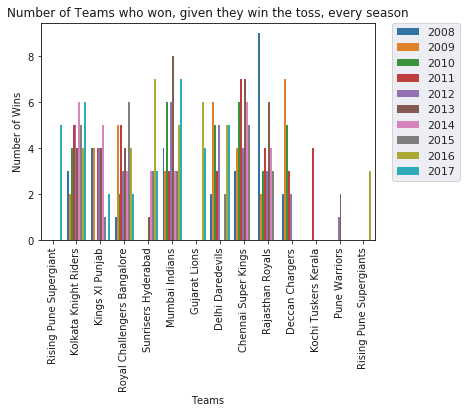 Output: 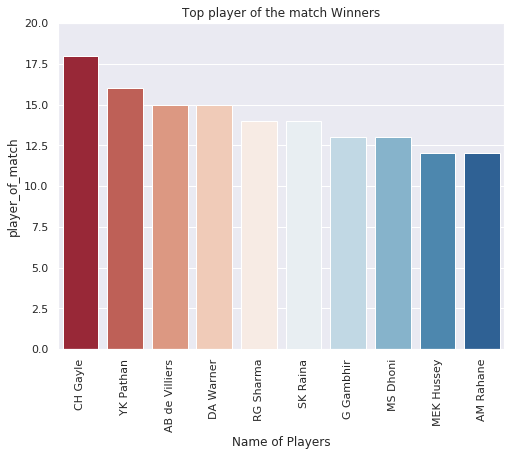 Output: 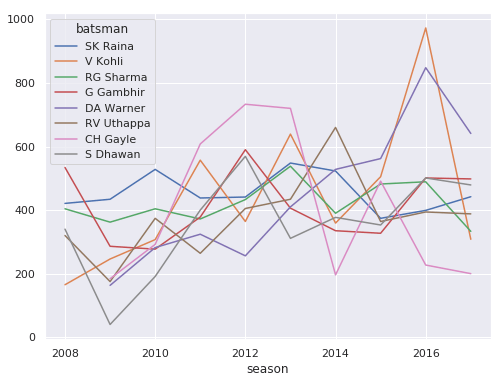 All the batsmen have their ups and downs in their careers. Output:  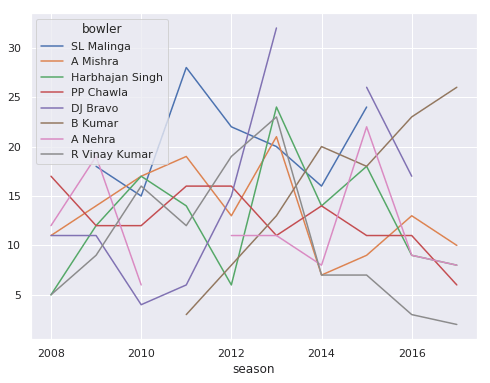 SL Malinga has been pretty consistent with his score. Output: 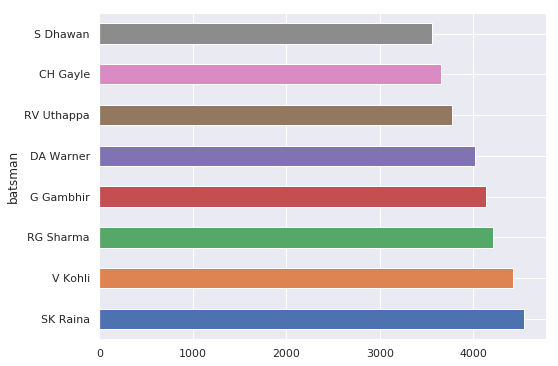 SK Raina has the highest runs throughout their IPL career. Output: 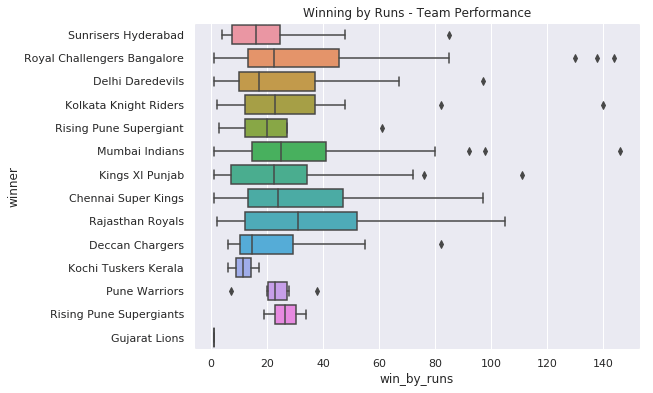 Output: 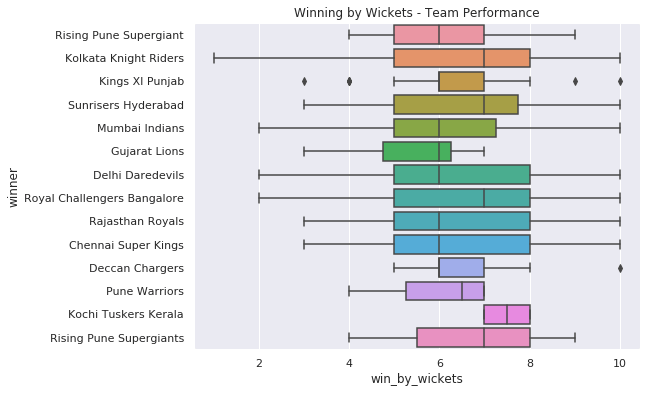 Now we will access the dataset that has been transformed for the purpose of prediction. Output:  Output:  We don't have any missing values in our dataset. Output:  Output:  We have encoded the Team names as numeric values. Output: 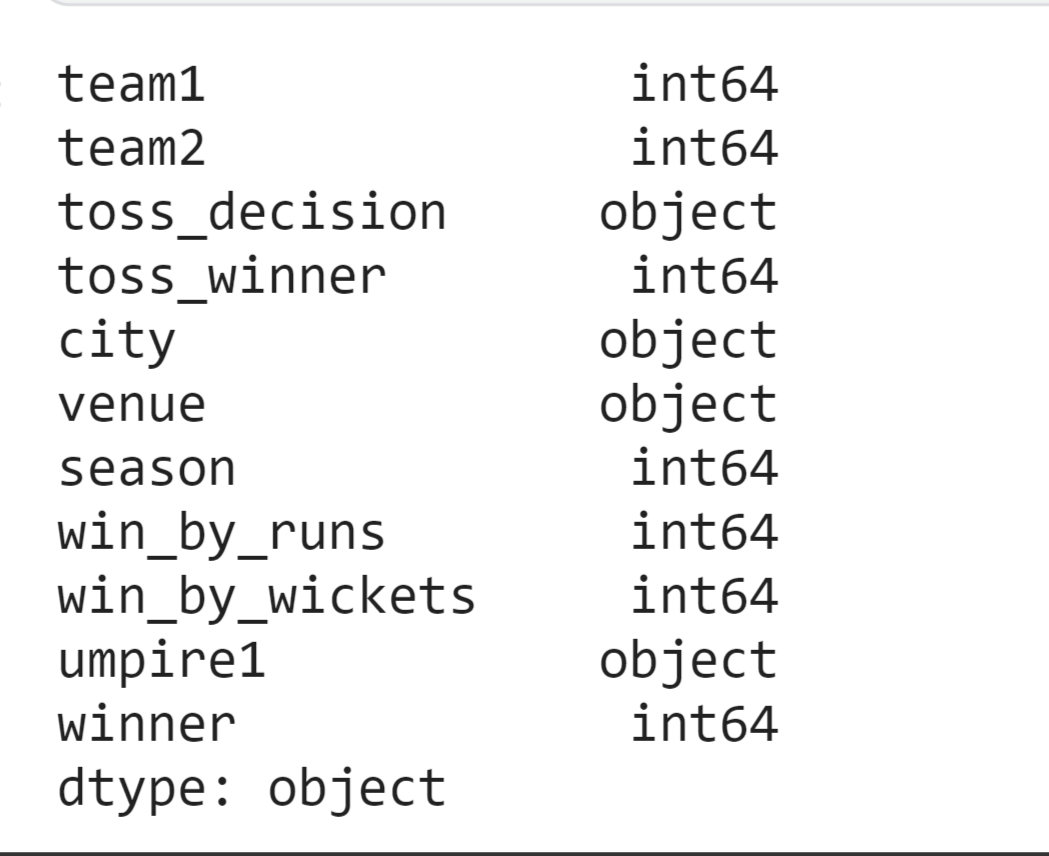 Output: 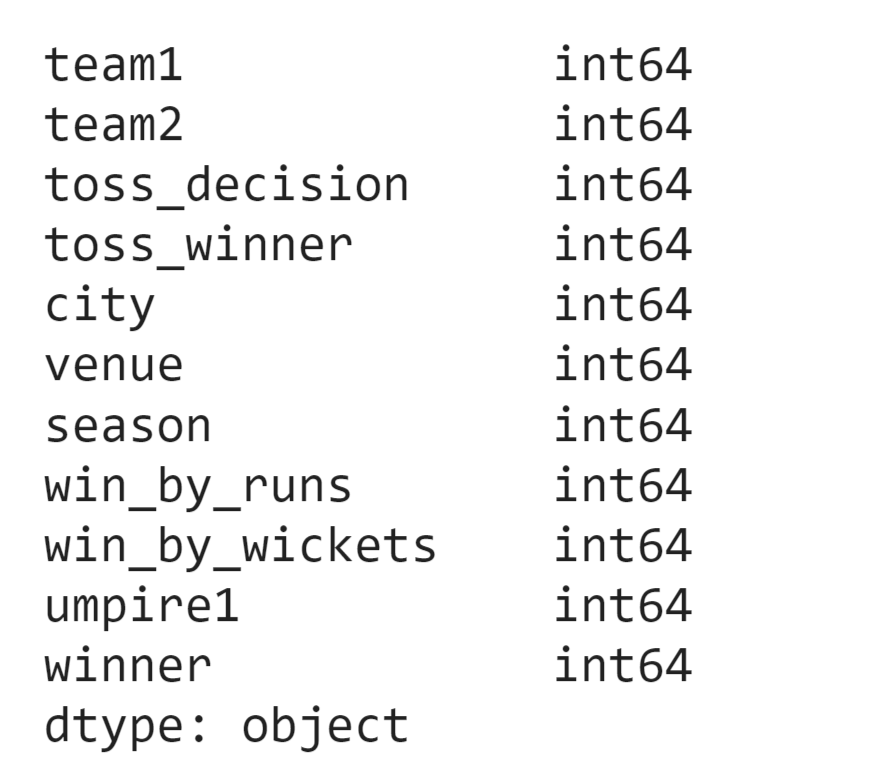 Output: 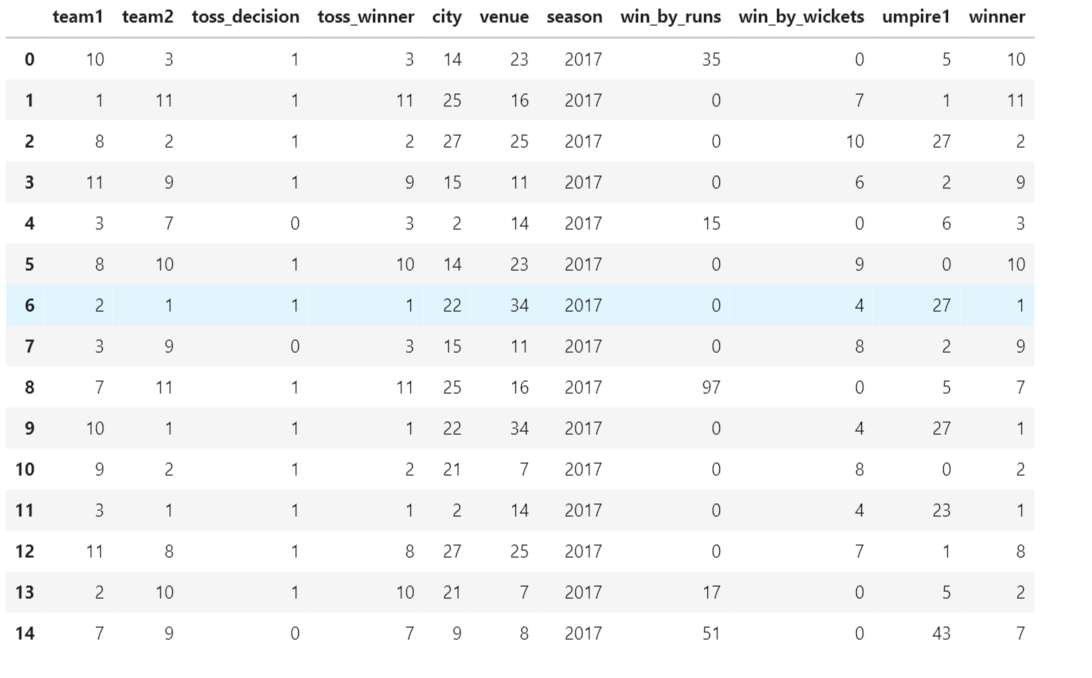 Splitting The Dataset into Training and Testing DatasetModelingNow we will look for various machine learning algorithms along with their learning curve and curse of dimensionality. 1. KNNOutput: 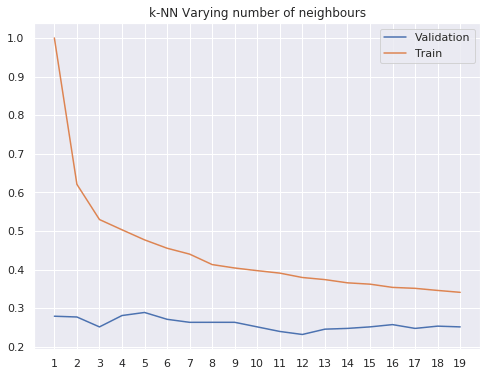 Learning Curve It is a graphical depiction of how well a model performs over time as it gains knowledge from training data. The curve often shows the model's error as a function of the quantity of training data utilized, such as mean squared error or classification error. Output: 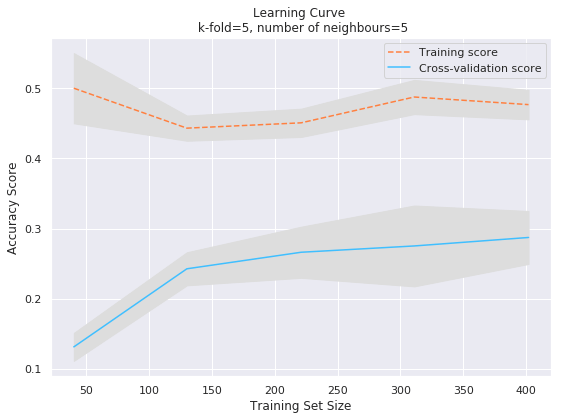 Here, as we increase the size of the training set, the accuracy of the model increases. But there is a sudden increase in the performance at the start, then it slowly increases. Curse of dimensionality The curse of dimensionality refers to the phenomenon in which the performance of many machine learning algorithms deteriorates as the number of features or dimensions in the data increases. Output: 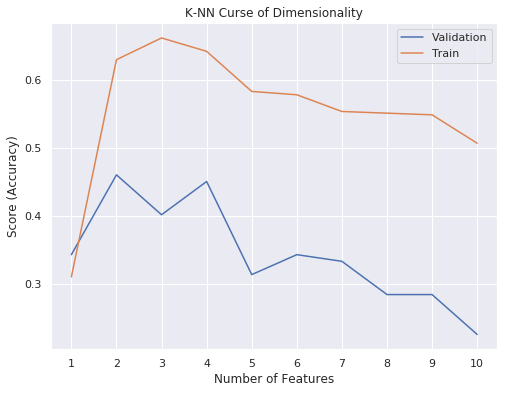 As per the graph, when the number of features increases, there is a steep increase in the performance, but gradually it deteriorates. Output:  The accuracy of KNN is 27% which is not appropriate for predicting the match. Output: 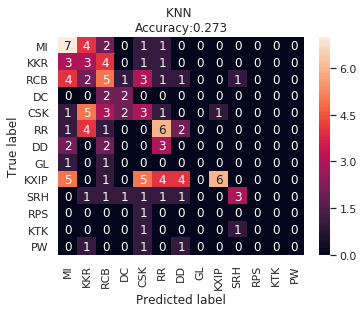 2. SVMOutput:  Output:  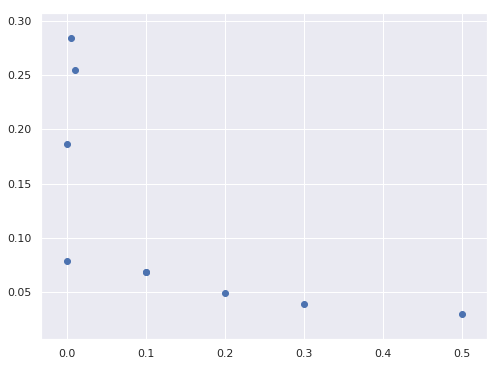 Output:  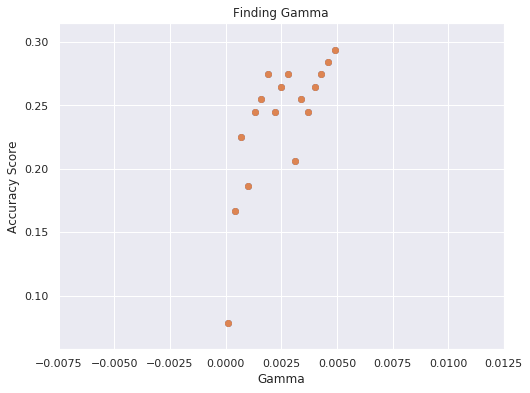 Output:  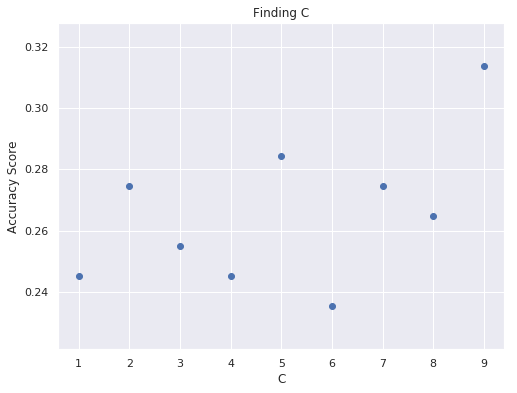 Output:  The performance of the model on the training set is very impressive, but while working on the test dataset, it does not meet up to the expectations that it shows on the training set. Learning Curve Output: 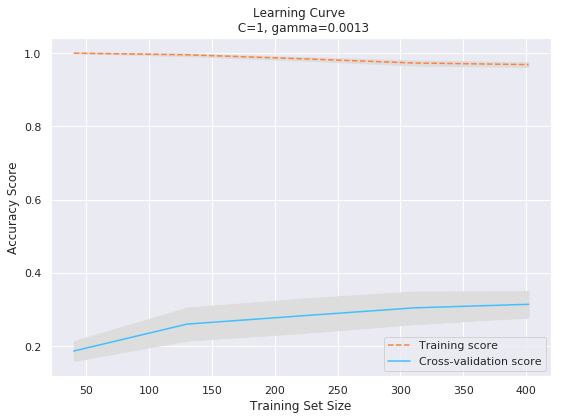 Here we don't see any increase in the accuracy after some in the validation score. Output: 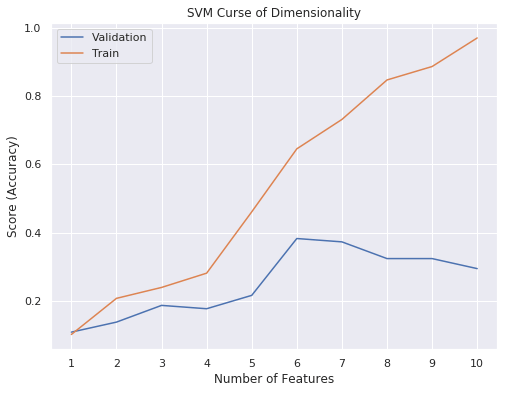 It's surprising that in training data, even after increasing the number of the performance increases, here and while in validation data, there is an increase in the performance at first, then the performance degrades. 3. Naive BayesOutput:  45%.we have really got good accuracy considering the past performance, which was quite low. Output: 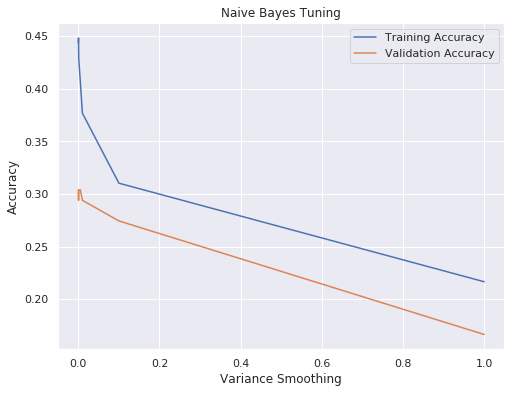 The increment in the number of features causes a rapid decrement in the accuracy of the model. So it will be better if we stick to a less number of Output:  The accuracy score of the model does not show any signs of improvement here. Output: 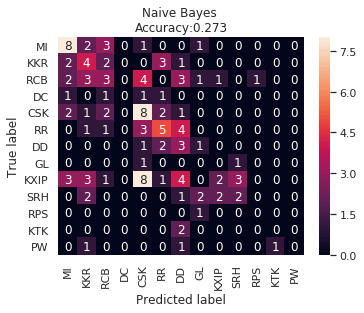 Learning Curve Output: 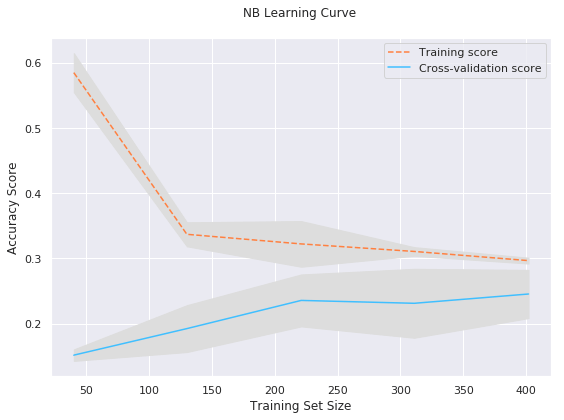 There is a decrease in the performance when we increase the number of features while working on the training set, but in contrast to it, it is the opposite in the testing set. Output: 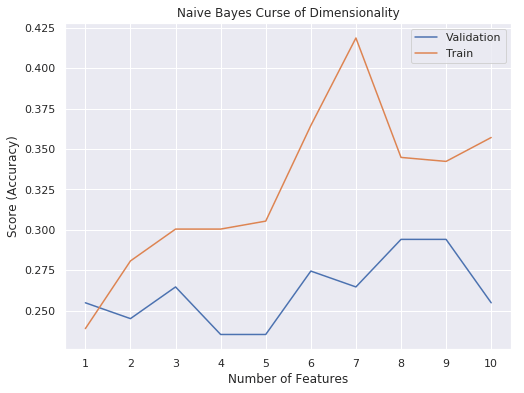 4. Decision Tree ClassifierOutput:  Output: 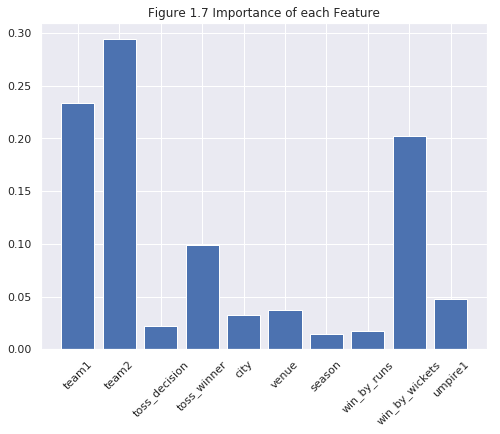 team2 has the highest importance among all the features. Output: 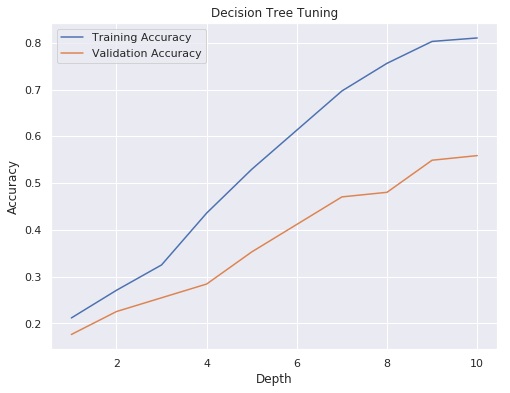 When we increase the number of features, then there is an increment in the performance of the model. Output: 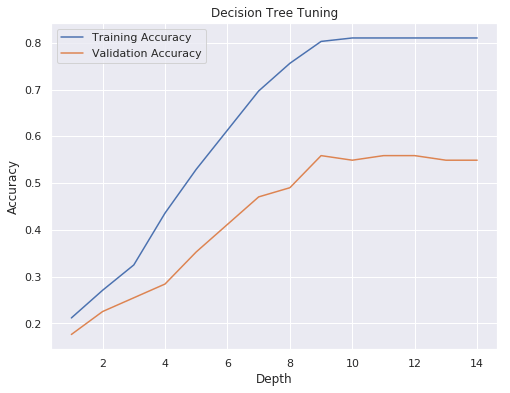 Considering a large number of features improves the efficiency of the model. Output: 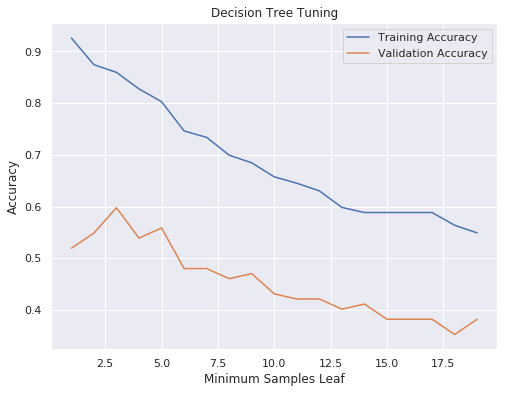 When we increase the number of samples, then there is a decrease in the accuracy of the model. Output:  The validation and Training score is good here. Output:  64% is the performance score for the DTC, which is quite high. Output: 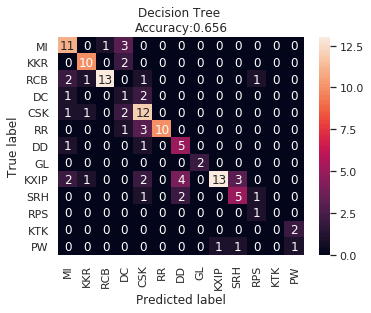 Learning Curve Output: 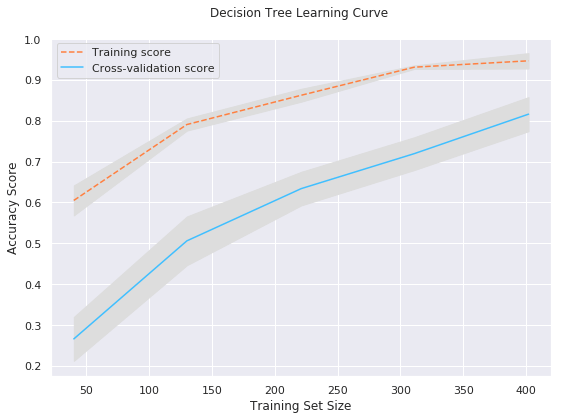 As you might have already predicted, when we increase the number of features, there is an increment in the accuracy of the model. Curse of Dimensionality Output: 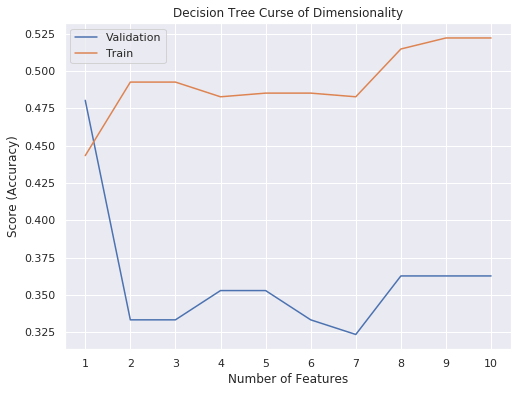 5. Logistic RegressionOutput:  The model Score is kind of okay. Output: 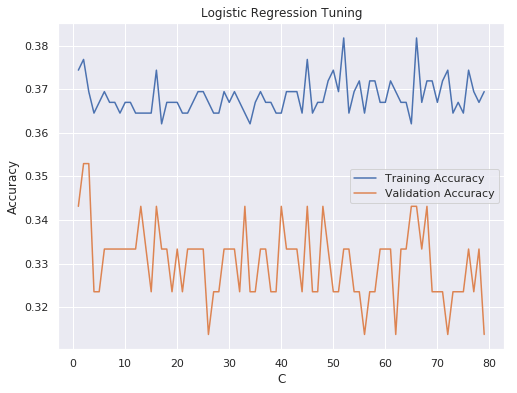 Output:  Output:  Output: 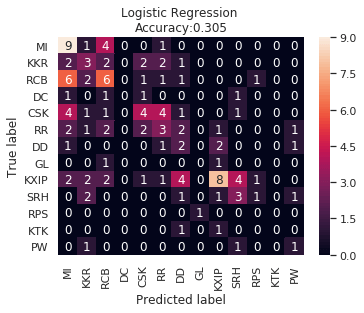 Learning Curve Output: 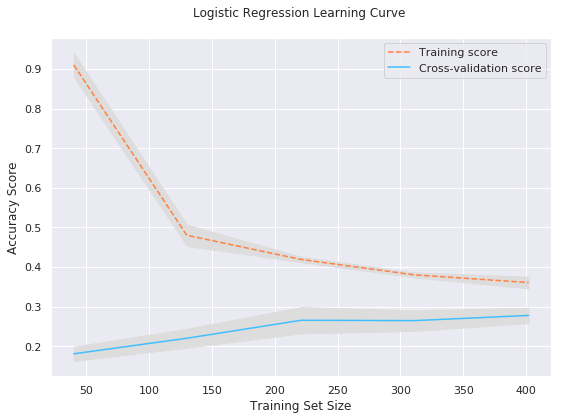 Increasing the size of the training set decreases the training score, whereas in Cross-Validation, at first, it increases. Curse Of Dimensionality Output: 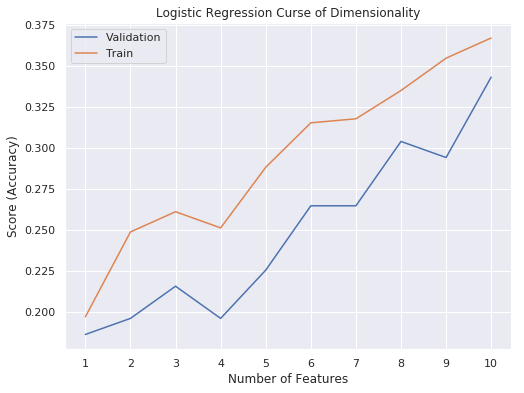 Increasing the size number improves the accuracy of the model in both validation and training sets. Model EvaluationOutput: 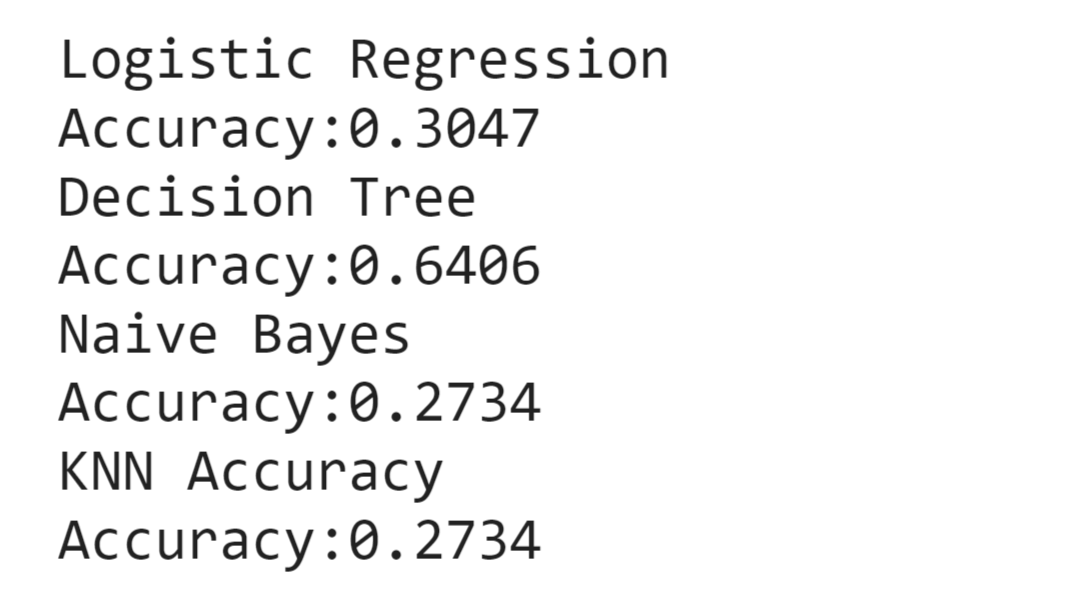 The Decision Tree has the highest accuracy among the models to predict the result of an IPL. A Decision Tree is able to do that because it encompasses a lot of factors together, which helps in predicting. ConclusionUtilizing the strength of data and cutting-edge algorithms, machine learning has completely changed how IPL predictions are made. Accurate forecasts of game results, player performances, and even tournament winners may be generated by analyzing past data, choosing pertinent attributes, and using a variety of machine-learning algorithms. Due to the inherent uncertainties in sports, no prediction model can guarantee 100% accuracy, but machine learning offers a data-driven approach that improves decision-making and gives the IPL another level of excitement. |