| |

Java PlotIn Java, Java Plot is a term which is mainly use for plotting coordinates on a cartesian plane. In Java, plotting of graph is done by using several topics of core Java. For plotting, we use swing, awt, and awt.geom.
In order to plot the point on a graph, we use several methods of graphics such as draw(), setPaint(), and Fill() etc. Let's take an example of a graph and understand how we can plot coordinates in Java. PlotExample.java Output: 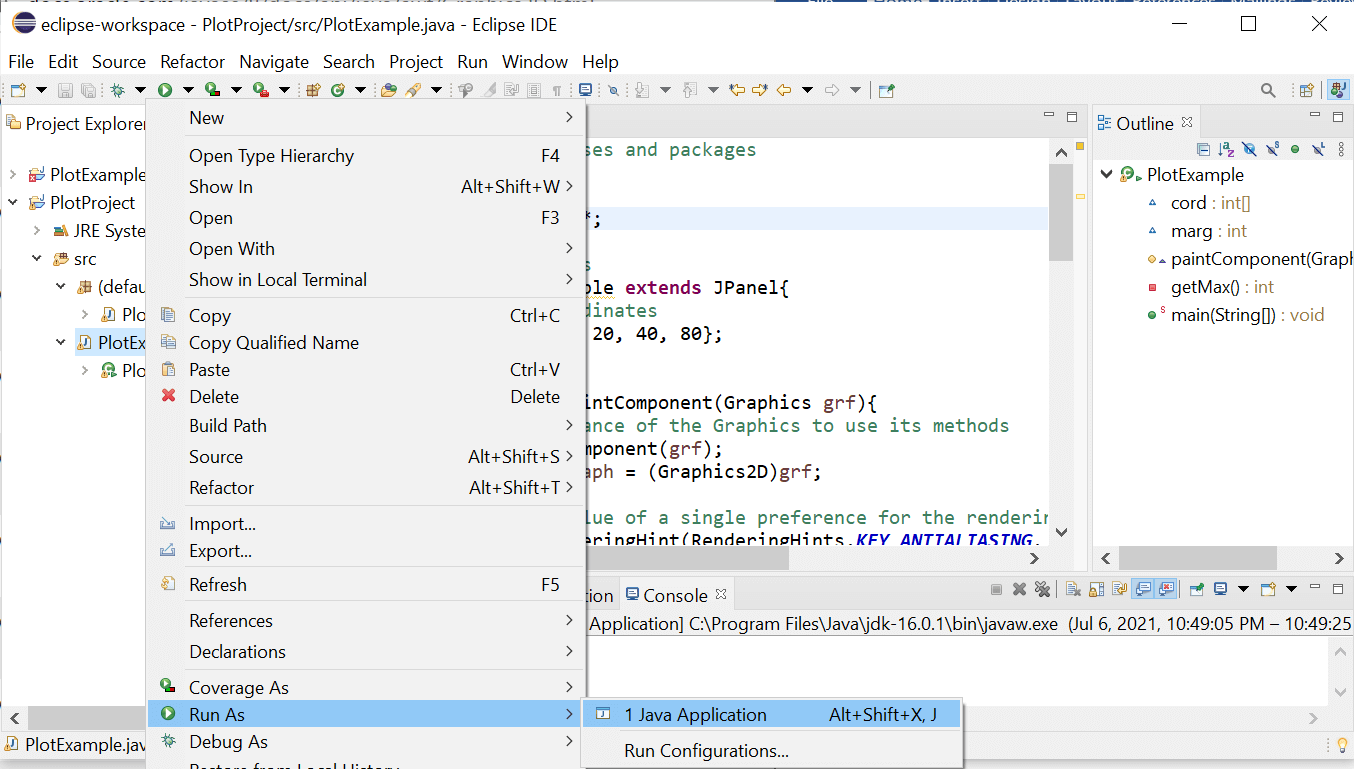
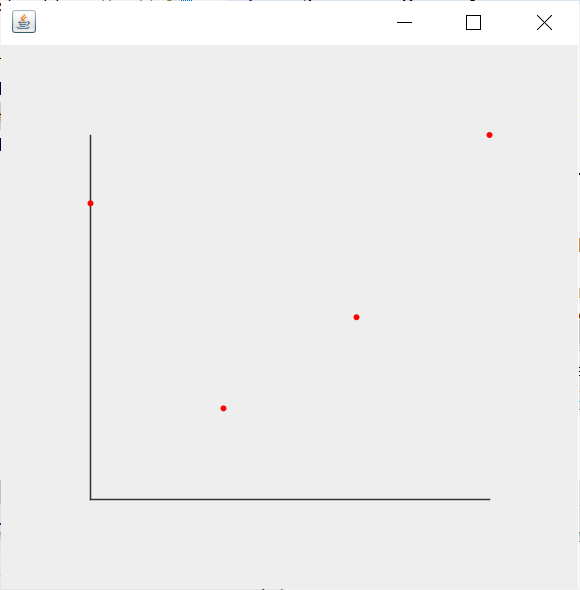
DescriptionIn the above code, PlotExample is the class which we create for plotting the graph, cord is an array of numbers which are treated as coordinates to be plot on the graph. We also extend the JPanel class for representing the graph. Note: By default, the layout of the Panel is Flow-Layout but we can set any other layout also such as grid layout, card layout, box layout, and border layout etc.We use super.paintComponent(g) to draw the graph on JPanel. In our code, we use Super keyword to call parent class method or constructor. In our case, the Super method calls the paintComponent(g) method of the JPanel class. We use Graphic 2D class(a fundamental class for two dimensional shapes) that extends Graphics class for providing control over geometry. We use RenderingHints which are basically suggestions for the Java 2D about how it should perform its rendering. In simple words, rendering means a way something is performed. We use setRenderingHints() method to set new hints and replace the old ones. We use Antialiasing to make smooth the jagged edges in case when the resolution is very low. In order to draw lines representing the x-axis and y-axis, we need four coordinates, i.e., x1, y1, x2, and y2. In our code, we use g1.draw() method to draw lines. We use the setpaint() method for setting the color of the points which we plot on the graph. We use the for loop in our code and inside of that loop, we use coordinates.length() method for finding the length of the coordinates array. We use the component's getWidth() and getHeight() methods of component that returns the height and width of the component. We use x1 and y1 variables to plot the points with respect to the size of the component instead of the cartesian plane.
Next TopicJavac Command Not Found
|
 For Videos Join Our Youtube Channel: Join Now
Feedback
- Send your Feedback to [email protected]
Help Others, Please Share


