| |

Java ProfilersJava profilers are the finest tools for understanding the behavior and troubleshooting the performance issues of the Java application. They monitor JVM execution of the byte code and provides the details of the garbage collection, heap memory usage, exceptions, class loading, etc. Sometimes we need to know the internal performance of the application. For an optimized application, writing code that just runs is not enough; we also need to know its internal performance, such as memory allocation, the implication of concurrent execution, areas where should be improvements, etc. The profilers help us to know the status of the JVM execution at the byte code level. There are several Java profilers available. In this section, we will discuss some leading Java profilers such as JProfiler, YourKit, Java VisualVM, and the Netbeans Profiler. 1) JProfilerJProfiler is a leading Java profiler in the market. It is a favorable choice for many developers. It provides an intuitive UI for viewing system performance, memory usage, potential memory leaks, and thread profiling. Using its extensive features, we can easily track the performance issues and optimize our Java application. It is a cross-platform tool that can be downloaded for different operating systems such as Windows, Mac OS, Linux, Solaris, etc. It also provides support for different IDEs such as NetBeans, Eclipse, IntelliJ, etc. The JProfiler can be downloaded using this link. 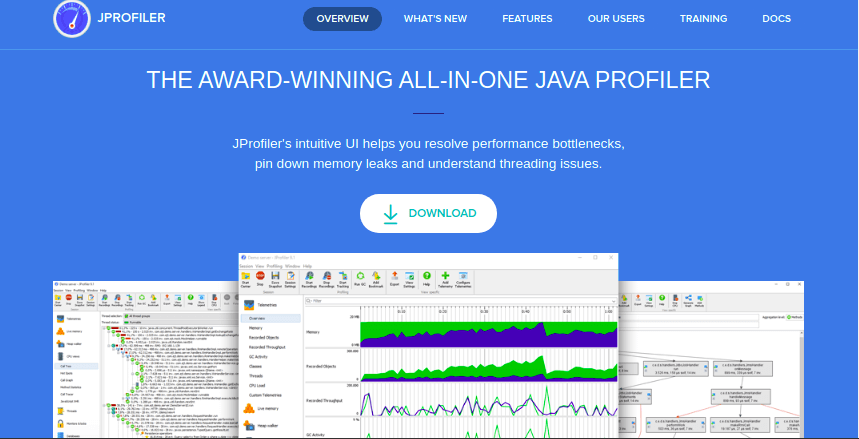
It provides many features such as Memory Profiling, Heap Walker, CPU profiling, Thread Profiling, Databases, etc., to track the performance issue in different sections. The JProfiler can be used for both local and remote applications. Using JProfiler, it is possible to profile Java applications running on a remote server without installing a single component. It also provides support for both the SQL and NoSQL databases. It supports profiling for the JDBC, JPA/Hibernate, Hbase databases, MongoDB, Casandra. The below image displays the profiling with the databases: 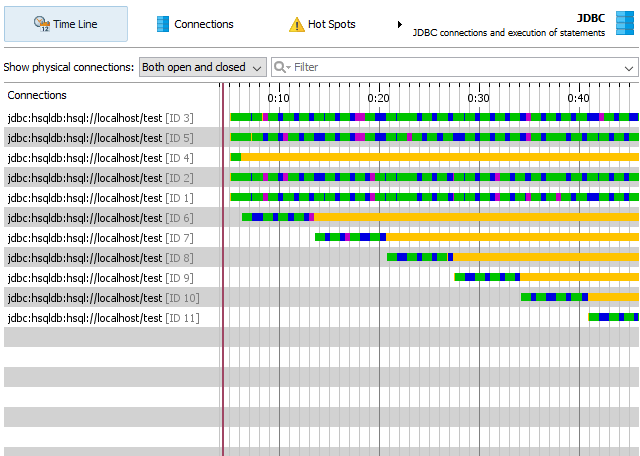
Let's discuss its features in details: Features of JProfilerJProfiler provides several extensive features to monitor and track the performance issues in different areas. Some key features of the JProfiler are as follows: Modes of Operation JProfiler provides the following modes of operations:
Heap Walker The Heap Walker allows us to take a snapshot of the heap and drill down to the interest's object by performing the selection steps. The heap walker has the following five views:
CPU PROFILING JProfiler offers various ways to record the call tree to optimize the Java project. We can choose the thread or thread group and thread status for all views. All views can be gathered on a method, class, component or package level. The CPU view section contains the following component:
Memory Profiling JProfiler's memory view section provides a dynamic view of memory usage and displays the information about the allocation spots. Each view has many aggregation levels and can display live and garbage collected objects. It contains the following components:
Thread Profiling JProfiler offers the following views for Thread profiling:
Monitor Profiling JProfiler offers the following views for the monitor profiling:
VM Telemetry JProfiler offers several telemetry views to analyze the internal state of the JVM. It offers the following views:
Databases JProfiler provides specific probes for the following databases:
JEE & Probes It offers probes for the following:
Probes display the following information about a component:
2) YourKit Java ProfilerYourKit is also a widely used profiler for Java applications. It is a cross-platform tool that supports different operating systems such as Linux, Windows, Mac OS, Solaris, FreeBSD, etc. Like the JProfile, it also provides several features to visualize threads, garbage collection, memory leaks, memory usage. It also supports local and remote profiling for using ssh tunneling. The below image displays the memory profiling for the tomcat server application: 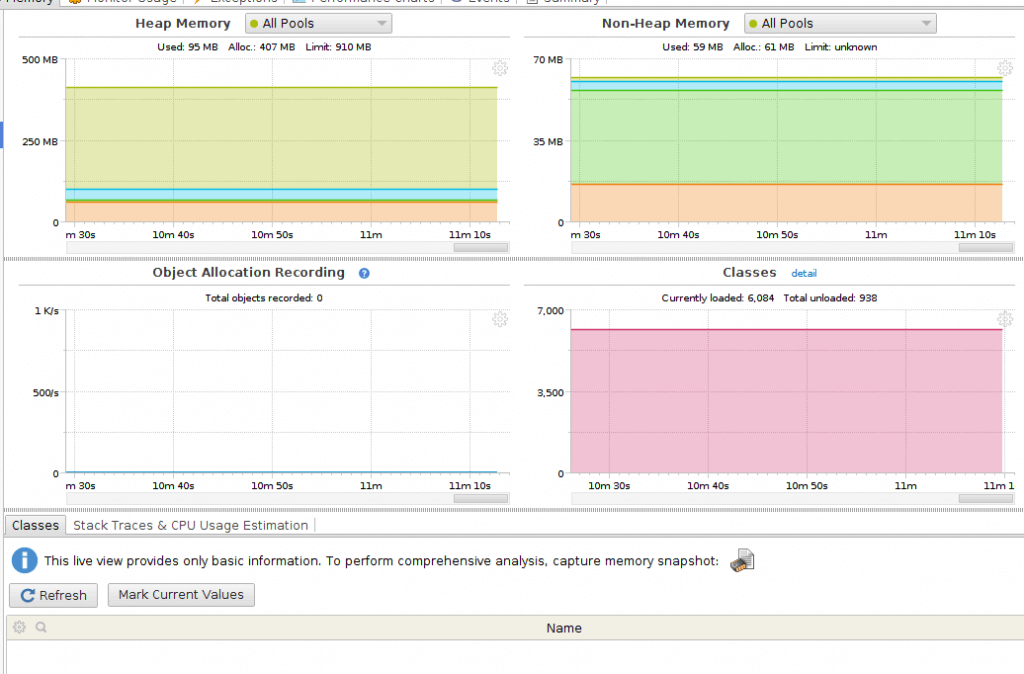
YourKit profiler is a handy tool when we want to profile thrown exceptions. We can easily decide which kinds of exceptions were thrown and how many times each exception occurred. It provides interesting CPU profiling features that primarily focus on specific areas of our code, like methods and subtrees in the thread. It is a very powerful feature of the YourKit tool as it provides conditional profiling through its what-if feature. Let's discuss its features: Features of YourKitBelow are some key features of YourKit Profiler: Excellent Java Profiler: YourKit provides an excellent way to profile Java applications at both production and development stages. CPU and memory profiling in Java has never been easier and fast performing tasks at the same time. But, Your Kit provides both the features at the same time. This provides an unparalleled advantage to Java developers. Task Ready YourKit provides profiling for all types of Java applications and servers on different platforms. It can be used locally and remotely. It is useful for detecting performance issues in the development, production, and testing phases. Integration with IDEs It provides plugin support for all the major IDEs such as Eclipse, NetBeans, IntelliJ IDEA, etc., for all kinds of Java applications. Further, it provides smart navigation from profiling results to source code. Profiling for the Remote Applications It provides an easy way to profile a remote application similar to the local application. When we need to profile a remote application, it will automatically configure everything. To start remote profiling, we need SSH access. CPU Profiling It utilizes many JVM and OS features to access the information about methods and times with minimum overhead. We can visualize the CPU profiles as call trees or a hot spots list. It provides a what-if feature that is smart enough to evaluate performance gains of the supposed optimizations without re-profiling the application. Flame Graphs It provides a CPU flame graph that is an efficient way to visualize application performance. We can find performance bottlenecks quickly and easily using the flame graphs. Database Queries and Web Requests YourKit profiler displays slow SQL queries and web requests to assist us in finding the performance congestions. It supports all major database tools such as MongoDB, Cassandra, and HBase. Memory Profiling It provides a memory profiler with a visual object heap and allows traversing of the object graph in any direction. It visualizes an object's properties in a convenient form and defines an appropriate way to display the content of a HashMap or a String value. We can see how much memory is retained by each object and what is happening when an individual reference in an object graph does not exist. It will save time and estimates the expected memory leak fix without altering the code. Comparing CPU and Memory Snapshots It tracks how our application's performance will be affected by changing the code. Further, it compares the performance and memory snapshots, and export comparison reports in different formats. Performance Inspections It provides 40+ comprehensive inspections to make code faster and more efficient. The YourKit profiler automatically diagnoses the typical issues in Java applications. We can easily find the leaked web apps, non-closed SQL statements and streams, duplicate objects in our application. It displays inefficient collections and I/O operations. Thread Synchronization Issues It displays the thread activity in the form of visuals. We can easily find blocked threads and reasons why they are blocked. In case of deadlock, it immediately shows a warning and information about the blocked threads. Using YourKit profiler, we can combine the states with HTTP requests and SQL queries to get complete detail of the requests processed by our application. Telemetry and Performance Charts It provides a customizable and user-friendly interface for monitoring CPU performance such as memory, GC activity, and others. Below is an image of performance tracking in YourKit: 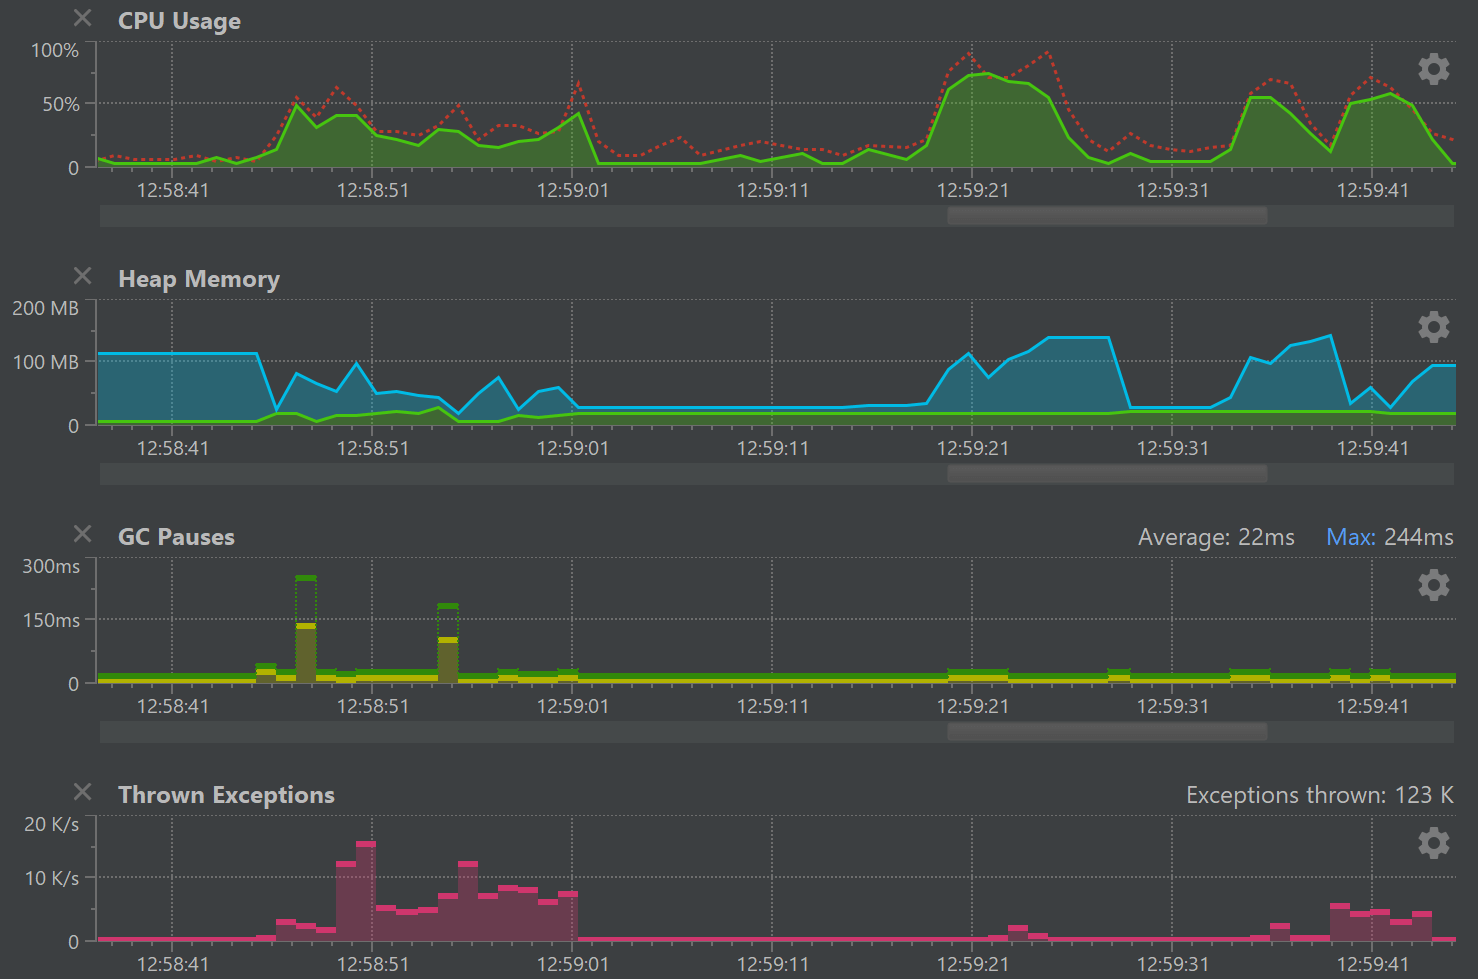
Exception Profiling It provides excellent exception profiling. In most cases, massive exception throwing is common, but it causes a hidden performance problem. The YourKit profiler finds all the locations where the exceptions are being thrown. Command-line Interface Many tech-savvy people love to use the command-line interface more than GUI. The YourKit command-line tool provides many tasks that can be performed without using its interactive UI. We can automate the performance monitoring by integrating it into a continuous integration process. 3) Visual VM Java ProfilerVisual VM is also a big name in the list of Java Profilers. It provides simple and robust profiling solutions to Java applications. By default, it is packaged with the JDK ( Java Development Kit). The profiling operation of this tool is dependent on other tools such as jconsole, jstat, jstack, jinfo, and jmap. Below is a basic user interface of the VisualVM Java profiler: 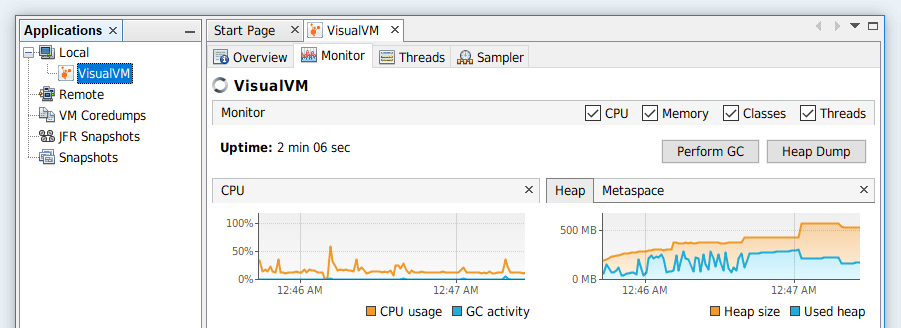
One major advantage of using the Java VisualVM is that we can extend its functionalities by developing plugins. Also, we can add these plugins to its built-in update center. It provides memory and CPU profiling as well as both local and remote profiling for Java projects. We need to provide credentials to connect it with remote applications. VisualVM does not provide support for ssh tunneling. Let's discuss its features: Features of Visual VMVisualVM provides a solution for monitoring and troubleshooting the Java applications running on Java 1.4+ using several other vendors. It uses various technology agents such as jvmstat, JMX, Serviceability Agent (SA), and Attach API. It provides perfect solutions for all the requirements of a developer, system admin, and quality engineer, and end-users. Some key features of the Visual VM are as follows: Detects Local And Remote Java Processes The Visual VM is capable enough to detect and list the running applications ( Locally and remotely). For this, jstatd must be running on the remote hosting machine. We can also manually specify the application using the JMX connection. Display Process Configuration And Environment It displays the process configuration and environment details such as PID, main class, passed arguments, JDK home, JVM version, JVM flags, and system properties. Monitor Process Performance And Memory It monitors the application's performance and memory usage. It displays CPU usage, GC activity, heap and metaspace, total loaded class, permanent generation memory, etc. Visualize Process Threads It displays all the running threads in visuals like a timeline together with aggregated running., wait, sleeping, park, and monitor times. Profile Performance And Memory Usage VisualVM contains both sampling and instrumentation profilers to analyze the performance and memory usage. It has the basic profiling capabilities for analyzing the performance and memory management of a Java application. Take And Display Thread Dumps It can take and display the thread dumps for an immediate analysis of the internals of the target process. It is useful for discovering the distributed deadlocks. Simultaneously thread dumps of multiple processes can be useful to discover distributed deadlocks. Take And Browse Heap Dumps It provides a .hprof memory snapshot which is created on request or OutOfMemory error. It is helpful for uncovering inefficient heap usage and debugging memory leaks. Analyze Core Dumps VisualVM can read the basic information about the crashed Java process and its environments. It can read from a core dump as well as open and extract a contained thread and heap dump. Analyze Application Offline VisualVM profiler can save application configuration and runtime environments and take a snapshot of thread dumps, heap dump into a single file, which can be processed offline as well. 4) NetBeans ProfilerNetBeans profiler is an excellent profiler that provides several advanced profiling tools. It is integrated into the NetBeans IDE. It provides profiling features such as CPU profiling, memory, locks, Sql queries, and threads profiling. It also supports JVM monitoring that is helpful in solving performance and memory issues. NetBeans profiler is a cross-platform tool that supports all the major operating systems such as Linux, Windows, Mac Os, Solaris, etc. 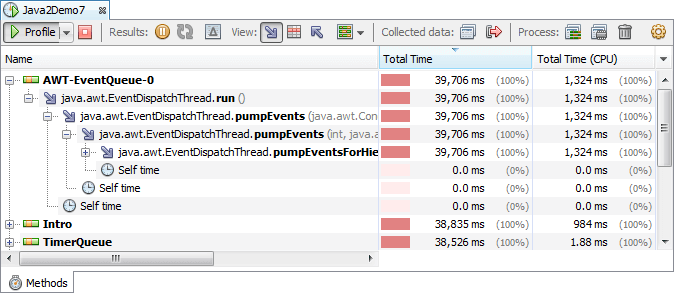
It is packaged with NetBeans IDE. It is much similar to VisualVM profiler. It will be useful if you want IDE and profiler in one place. All other above-mentioned profilers provide plugin support for IDEs. 5) Java Mission ControlJava Mission Control (JMC) is a new Java profiler and diagnosis tool. It provides several features for basic monitoring, managing, and production time profiling. It is a fast-performance tool and minimizes the performance overhead. The performance overhead has always been an issue with the profilers. It is a JVM-based tool that works at runtime. The JMC provides JMX (Java Management Console ), JFR (Java Flight Recorder), and many other plugin tools. The JMX is useful for monitoring and managing the Java application, and JFR is a profiler. Java Mission Control provides plugin support for several IDEs such as Eclipse. See more about Java Mission Control. Other Useful ProfilersWe have mentioned some leading Java profiler. Besides the mentioned profiler, there are some other powerful Java profilers available in the market. Some useful and widely used Java profilers are New Relic and Prefix. These profilers also provide several profiling features such as CPU profiling, memory profiling, garbage collector, etc. However, these profilers have fewer users than the discussed profiler, but they deserve mention in this article. Some users find these profilers more useful than some leading profilers. For example, Prefix is an excellent profiling tool. It provides support for Java applications as well as other web applications. ConclusionIn this article, we have discussed leading Java profilers; we have seen each profiler with their unique features and what makes them a potential Java profiler. There are many other Java profilers available in the market, having some unique features. So it is completely dependent on your requirement that which profiler will be more useful for your project.
Next TopicJava XOR
|
 For Videos Join Our Youtube Channel: Join Now
Feedback
- Send your Feedback to [email protected]
Help Others, Please Share


