| |

Java Stack TraceIn Java, stack trace is nothing but location of the exceptions. In other words, we can say that stack trace hunt (trace) for the next line where exception may raise. In this section, we will discuss Java stack trace in detail. What is stack trace?In Java, the stack trace is an array of stack frames. It is also known as stack backtrace (or backtrace). The stack frames represent the movement of an application during the execution of the program. It traces the locations where exception raised. It collects the information of all the methods that are invoked by a program. When we do not care about the unhandled exceptions and the program throws the exceptions then Java stack trace prints the stack trace on the console by default. The JVM automatically produces the stack trace when an exception is thrown. In stack trace, each element represents a method invocation. 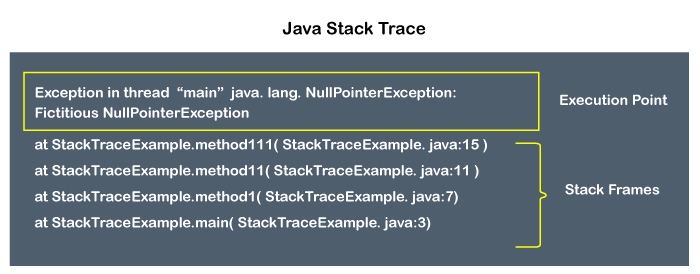
Java Throwable class provides the printSatckTrace() method to print the stack trace on the console. After introducing Java 1.5, the stack trace is encapsulated into an array of a Java class called StackTraceElement. The array returned by the getStackTrace() method of the Throwable class. Each element is represented by a single stack frame. All stack frames denote the method invocation except for the first frame (at the top). The first frame denotes the execution point on which JVM generates the stack trace. The StackTraceElement class provides a constructor that parses four parameters as an argument and creates a stack trace element that denotes the specified execution point. Parameters:
It throws the NullPointerException if the parameters declaringClass and methodName are null. Let's see the textual representation (syntax) of the stack trace. Let's understand the stack trace. The first line denotes: 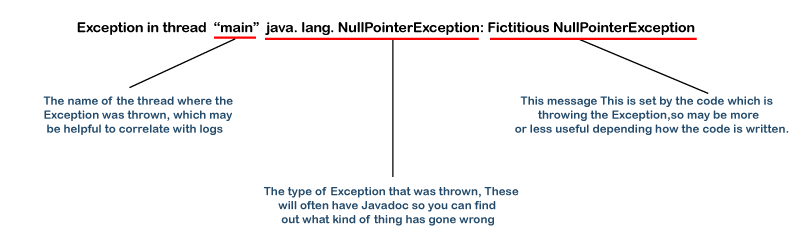
The other line(s) denotes: 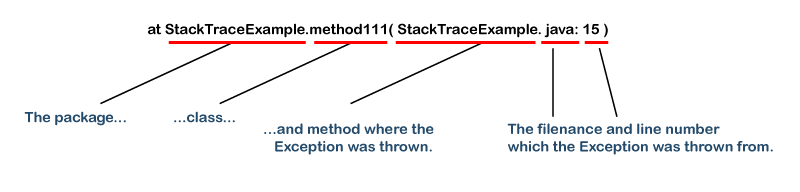
Java Stack Trace ExampleStackTraceExample.java Let's run the above program and see the stack trace. 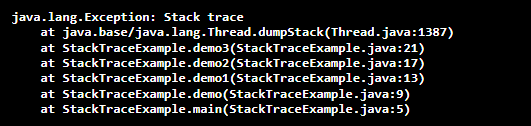
At the first line of the stack trace, we get the execution point of the stack and from second line to the end line we get the stack frames that form the complete stack trace. We see that the method executed first becomes the last stack frame of the stack trace and the method executed at last becomes the first stack frame of the stack trace. Therefore, each element of the stack trace represents a stack frame.
Next TopicArray Slicing in Java
|
 For Videos Join Our Youtube Channel: Join Now
Feedback
- Send your Feedback to [email protected]
Help Others, Please Share


