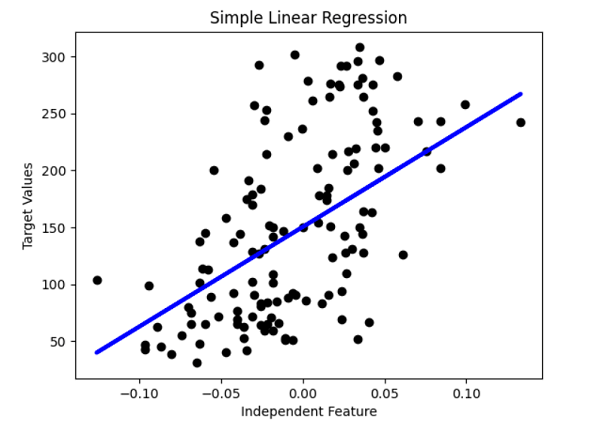
Sklearn Linear Regression ExampleA machine learning algorithm built on supervised learning is called linear regression. It executes a regression operation. Regression uses independent variables to train a model and find prediction values, and it is mainly used to determine how variables and predictions relate to one another. Regression models vary according to the number of independent variables in use, the relationship they consider between the dependent and independent variables, and other factors. This tutorial will show how to apply linear regression to a given dataset using several Python modules. Since a single linear model is simpler to visualise, we'll use it as our example. The model will use the sklearn diabetes dataset in this presentation to learn. How to use Linear Regression in Sklearn?A Python package called Scikit-learn simplifies using various Machine Learning (ML) methods for studying predictive data, including linear regression. Finding the straight line model that best fits a collection of scattered data points is known as linear regression; we can then extrapolate the curve to foretell new data points. Linear regression is a vital Machine Learning technique due to its simplicity and key characteristics. Linear Regression using Sklearn ExampleCode Output: Value of the coefficients: [875.72247876] Mean square error: 4254.602428877642 Coefficient of determination: 0.3276195356900222 Sklearn Linear Regression Example Using Cross-ValidationMany ML models are trained on portions of the raw data and then evaluated on the complementing subset of data. This process is known as cross-validation. To identify overfitting or to fail to generalise a pattern, use cross-validation. Cross-validation involves the following three steps:
We generate multiple small train-test splits using our original training dataset through cross-validation. We use these splits to train our model, which best describes the relationship between dependent and independent variables. For the standard k-fold cross-validation test, we split the original dataset into k subgroups. After we have trained the linear regression model iteratively using the k-1 dataset, we use the remaining dataset to validate the model. This allows us to validate the model on a new dataset to know if the model describes a good relationship or not. In this section, we'll learn how to use cross-validation tests on a linear regression model using sklearn. Additionally, we will see a method to improve the accuracy provided by the KFold cross-validation method. Code Output: Accuracy score of each fold: [0.41676766 0.45263441 0.44526044 0.43015152 0.40605028 0.41904005] Mean accuracy score: 0.4283173940888665 To improve the accuracy of the KFold cross-validation test, we can use the stratified KFold method Code Output: Size of the dataset is: 442 Stratified k-fold Cross Validation Scores are: [0.50117449 0.45486492 0.46935982 0.5599043 0.50545775 0.42289802] Average Cross Validation score is: 0.48560988266624 Multivariate Linear Regression by Using Python SklearnA supervised machine learning approach called multivariate regression used many independent data features to analyse the target feature. One dependent variable and many independent variables make up a multivariate regression, which is an elaboration of the multiple regression models. We attempt to forecast the result by training the model using the independent variables. Multivariate regression uses a formula to describe how several variables react concurrently to changes in the target variable. Data Pre-processingMost ML programmers believe that data pre-processing is among the most crucial phases of a regression model project. There may be excessive data points, reporting mistakes, or many other problems that prevent an algorithm from making an accurate prediction for the dataset. Before the dataset is ever fed into an ML model, data scientists spend numerous hours cleaning, normalising, and scaling the data to avoid this. Standardizing functions, such as the MinMax and Standard functions, are the most frequent function types to perform feature scaling. This is due to the range of the features in your data. Euclidean distance is used by almost all machine learning methods to estimate the separation between two data points. By scaling every point in the collection to fit within the same range, scale standardization functions enable algorithms to calculate distance accurately. We must first import sklearn.preprocessing and numpy for both. Multiple Linear Regression Sklearn exampleCode Output: sepal length (cm) sepal width (cm) petal length (cm) petal width (cm) \ 0 5.1 3.5 1.4 0.2 1 4.9 3.0 1.4 0.2 2 4.7 3.2 1.3 0.2 3 4.6 3.1 1.5 0.2 4 5.0 3.6 1.4 0.2 target 0 0 1 0 2 0 3 0 4 0 R-square score of the model: 0.9215461211058802 Features Coefficients 0 Intercept 0.279851 1 sepal width (cm) -0.006845 2 petal length (cm) 0.297868 3 petal width (cm) 0.507009 Next TopicPython Timeit Module |

We provides tutorials and interview questions of all technology like java tutorial, android, java frameworks
G-13, 2nd Floor, Sec-3, Noida, UP, 201301, India


