| |

Introduction to Distributed TracingDistributed TracingDistributed tracing is a technique to monitor and profile the applications, especially those built using microservice architecture. It is also known as distributed request tracing. Developers use distributed tracing to debug and optimize the code. Distribute tracing provides a place where we can see that "what is happening with a specific request?" It is important because there are a variety of components that are involved in the microservices. If we want to solve a problem or debug a problem, we need a centralized server. So the term distributed tracing comes into existence. In this section, we will use Spring Cloud Sleuth with Zipkin. Spring Cloud Sleuth assigns a unique Id to each request that we have made. We can trace all the requests based on unique Ids across all the components. Spring Cloud SleuthSpring Cloud Sleuth is a Spring Cloud library that provides the ability to track the progress of subsequent microservices by adding trace and span Ids on the appropriate HTTP request headers. The Sleuth library is based on the MDC (Mapped Diagnostic Context) concept, where we can easily extract values, put to context, and display them in the log. ZipkinZipkin is an open-source, Java-based distributed tracing system. It has a management console that provides a mechanism for sending, receiving, storing, and visualizing traces details of the subsequent services. With the help of the Zipkin server, we can put all the logs of all the components in the MQ (RabbitMQ). We send the logs to the Zipkin server where the logs consolidate. After doing this, we can monitor different requests. We can also find what is happening to a specific request? Implementing distributed tracing Using Spring Cloud SleuthIn this step, we will add Spring Cloud Sleuth for all the microservices. It adds a unique Id to all the requests. It is used to generate and attach the trace Id, span Id to the logs so that tools (Zipkin) can use these ids. 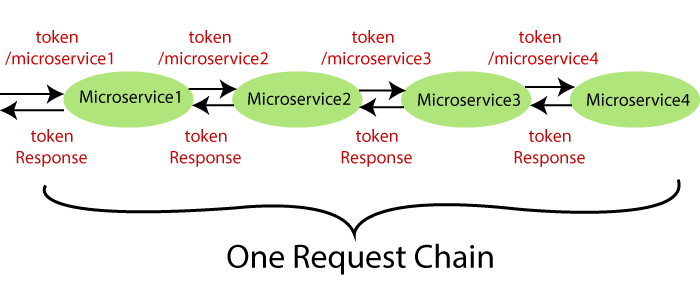
The Spring Cloud Sleuth token has the following components:
The following figure shows the Spring Cloud Sleuth token. 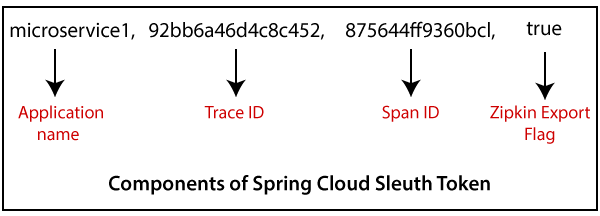
Let's implement the Spring Cloud Sleuth in our projects. Step 1: Select the project netflix-zuul-api-gateway-server. Step 2: Open pom.xml and add the Sleuth dependency. Now we need to trace all the requests. If we want to trace all the requests, we would need to create ALWAYS_SAMPLE. We can create a Sampler by using a Bean. Sampler Distributed tracing may have a very high volume of data, so the sampling is important in distributed tracing. Spring Cloud Sleuth provides a Sampler strategy. With the help of Sampler, we can implement the sampling algorithm that provides control of the algorithm. By default, we get a procedure that continuously performs the tracing if a span (correlation: is an individual operation) is already active. But the newly created spans are always marked as non-exportable. If all the applications are running with the Sampler, we can see trace (end-to-end latency graph that is composed of spans) in the log, not in any remote location. By default, Spring Cloud Sleuth sets all spans to non-exportable. When we export span data to the Zipkin or Spring Cloud Stream, Spring Cloud Sleuth provides AlwaysSampler class that exports everything to the Zipkin. It also provides a PercentageBasedSampler class that samples a fixed fraction of span. Remember: If you are using Spring 2.0.0 or above versions, use the following Sampler. We have used the same because we are using Spring version 2.2.1. Step 3: Open NetflixZuulApiGatewayServerApplication.java file and define a Bean. NetflixZuulApiGatewayServerApplication.java In the above code, we have added Spring Cloud Sleuth to the Zuul API Gateway server. Now we have to define Bean in currency-exchange-service and currency-conversion-service also. Step 4: Open pom.xml of currency-exchange-service and add the Sleuth dependency. Step 5: Open CurrencyExchangeServiceApplication.java file and define a Bean. CurrencyExchangeServiceApplication.java Step 6: Similarly, Open the pom.xml of currency-conversion-service and add the Sleuth dependency. Step 7: Open CurrencyConversionServiceApplication.java file and define a Bean. CurrencyConversionServiceApplication.java Now we have three applications that are connect to Spring Cloud Sleuth. Step 8: Launch the applications in the following order: netflix-eureka-naming-server
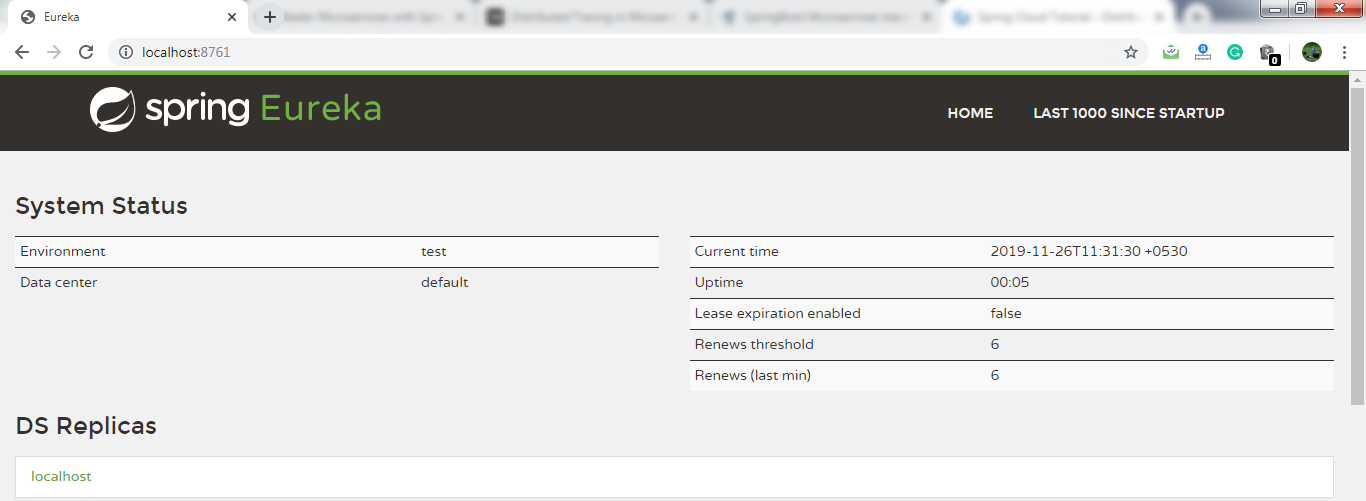
currency-exchange-service (on port 8000) currency-conversion-service netflix-zuul-api-gateway-server Remember: After launching each service, refresh the Eureka server. It shows all the instances currently registered with the Eureka server. 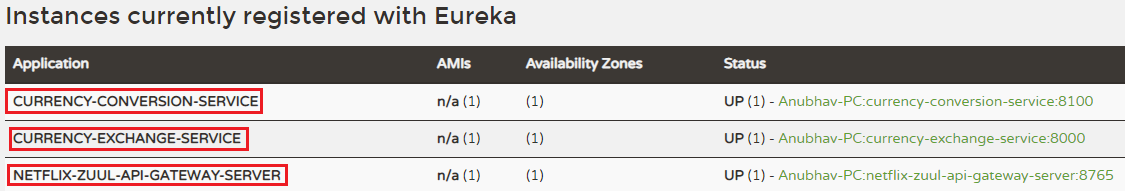
Step 9: Open CurrencyExchangeController.java file and add a logger into it. CurrencyExchangeController.java Similarly, we will add logger into CurrencyConversionContoller. Step 10: Open CurrencyConversionContoller.java file and add a logger into it. CurrencyConversionContoller.java Step 12: Execute the request http://localhost:8100/currency-converter-feign/from/EUR/to/INR/quantity/100. It returns the following response, as shown below. 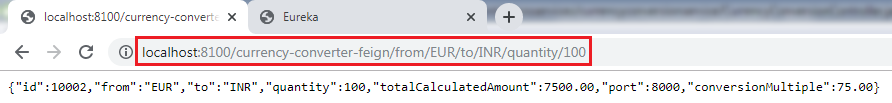
Let's see the log of currency-conversion-service in the console. The currency-conversion-service shows the following log: 
We can also see the log of currency-exchange-service. The currency-exchange-service shows the following log: 
Similarly, we can see the log for netflix-zuul-api-gateway-server. 
Let's have a close look at the above three logs for different services. We find that all three services have the same trace Id (533f8d3966d8f4e7). Spring Cloud Sleuth assigns a trace Id to the request. We can use this Id to trace the requests across multiple components. But there is a problem that this log is distributed in multiple places. We use Zipkin to remove this problem. With the help of Zipkin, we can centralize the logs in one place. Distributed Tracing with ZipkinWe have installed Spring Cloud Sleuth dependency in currency-conversion-service, currency-exchange-service, and netflix-zuul-api-gateway-server. We have seen that a unique Id was being assigned to each request. We use these Id to trace the request across the logs of these multiple services. However, we face a challenge in tracing. If we want to trace a request, we have to check the log of the individual application. The solution to this problem is called centralized logs. We need to centralize all the logs from all the microservices. We can search through Id assigned by Spring Cloud Sleuth. At the centralized place, we will able to search and find out what is happening to a specific request. There are the following solutions for centralize logging:
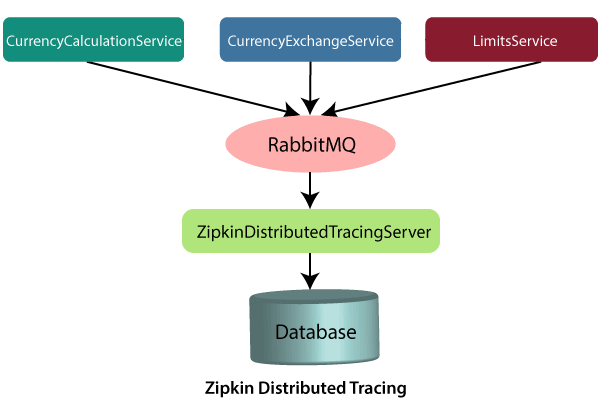
In this distributed tracing, we will use Zipkin distribute tracing server. It gives us a consolidated view of all the microservices. We get all the logs messages form the individual microservices. The Zipkin server collects the log messages. All the microservices puts the log messages on the queue called RabbitMQ, and the Zipkin picks these log messages from the RabbitMQ. The Zipkin tracing server is connected with the database. In our case, we use the in-memory database. We will pull log messages from the database. In the next step, we will install RabbitMQ.
Next TopicInstalling RabbitMQ Server
|
 For Videos Join Our Youtube Channel: Join Now
Feedback
- Send your Feedback to [email protected]
Help Others, Please Share


