| |

How do you draw a cash flow diagram in Excel?A cash flow diagram: what is it?An Excel cash flow diagram is a visual aid that shows information about the amount of money coming in and going out over a given period. It comprises flows and nodes that stand in for the inflow and outflow of currency.
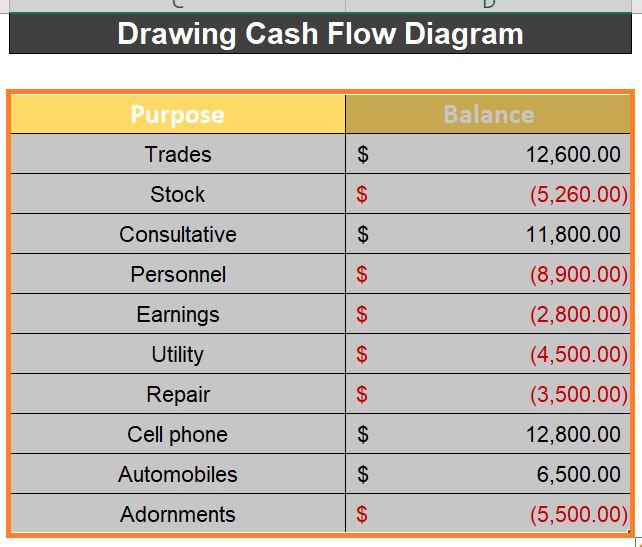
IntroductionMaking a cash flow diagram for sales is sometimes necessary when dealing with Microsoft Excel's sales-related spreadsheets to comprehend the sales conditions necessary for a company to profit. Excel makes it simple to create a cash flow diagram. It also saves time to do this task. In this tutorial, we'll discover five efficient methods that will teach you how to create a cash flow diagram using Excel with the right pictures. These are used by engineers and management accountants to show, within the framework of engineering and business economics, the financial transactions that will take place during a project. Transactions may include initial investments, maintenance costs, projected project earnings/savings, and the salvage and resale worth of the equipment. Next, these diagrams and the associated modelling are used to calculate the break-even point. Additionally, they are employed in a broader and more in-depth evaluation of operations and profitability. Step-by-Step Procedure on How to Create a Cash Flow Diagram Using ExcelSuppose we have a dataset detailing the ABC group's income and expense statements. Columns C and D, respectively, provide an explanation of the income and expense as well as the running balance. We will first create a dataset using parameters. Next, we will create an Excel cash flow diagram to comprehend the ABC group's running balance. The dataset for the work at hand is summarised here. Step 1: Create a Dataset with Appropriate SettingsThis section will create the dataset for an Excel cash flow chart. The income and cost statement for the ABC group will be included in a dataset we build. Our dataset thus becomes. 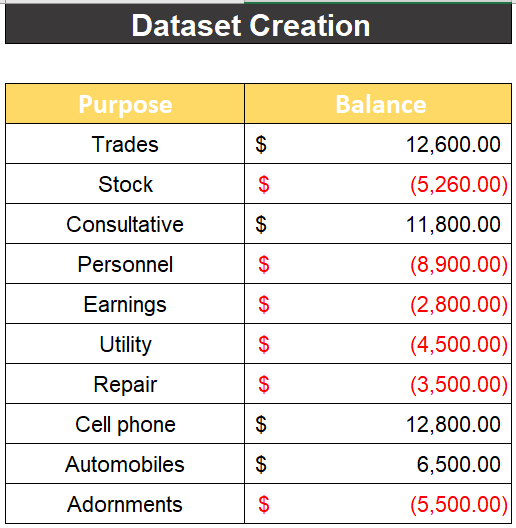
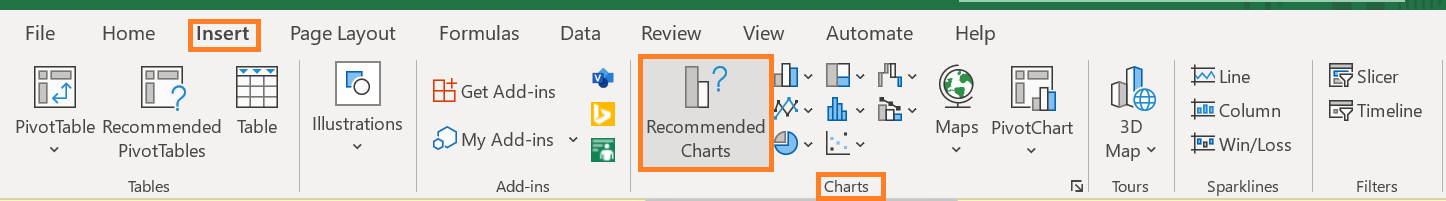
Step 2: Use Charts GroupWe will now create a cash flow diagram from our dataset using the Charts group option within the Insert ribbon. This work is easy. It also saves time to do this task. Now, let us make an Excel cash flow diagram by following the below steps!
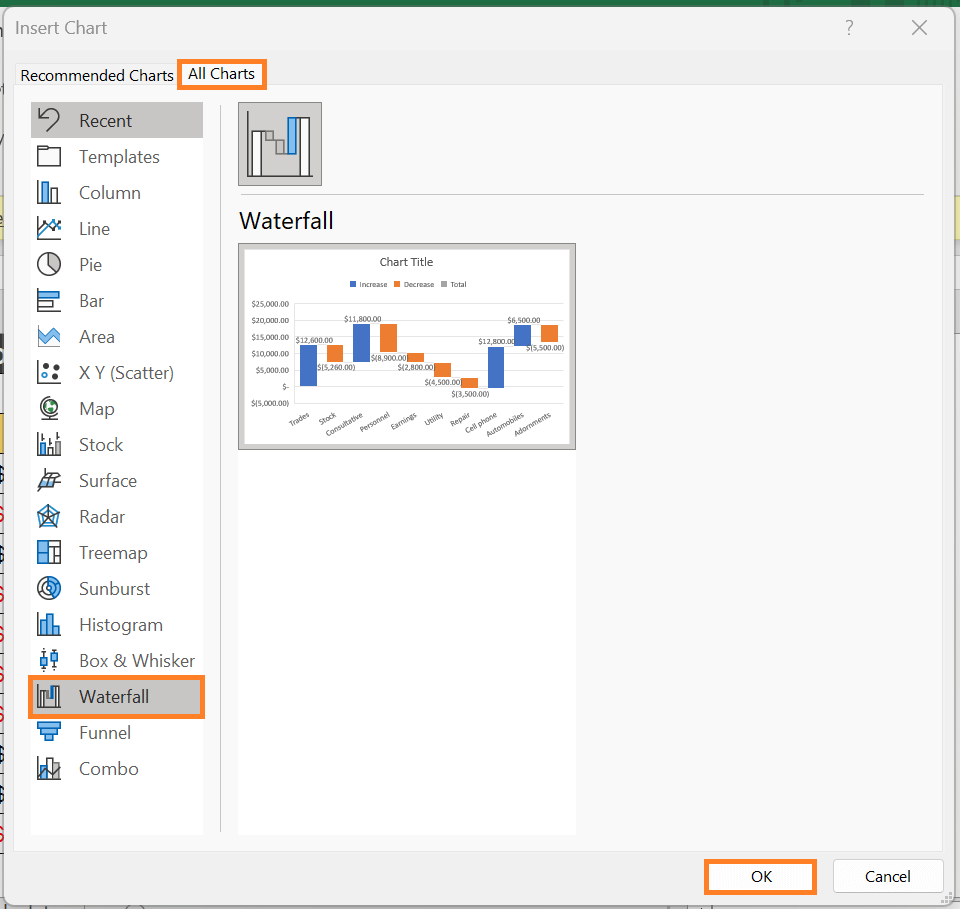
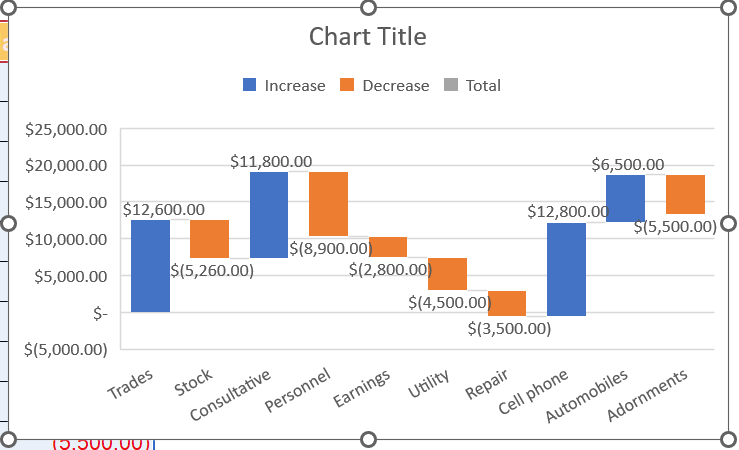
Step 3: Using the Waterfall Chart OptionWe'll create a cash flow diagram using the waterfall option in this step. Let's learn by following the guidelines below!
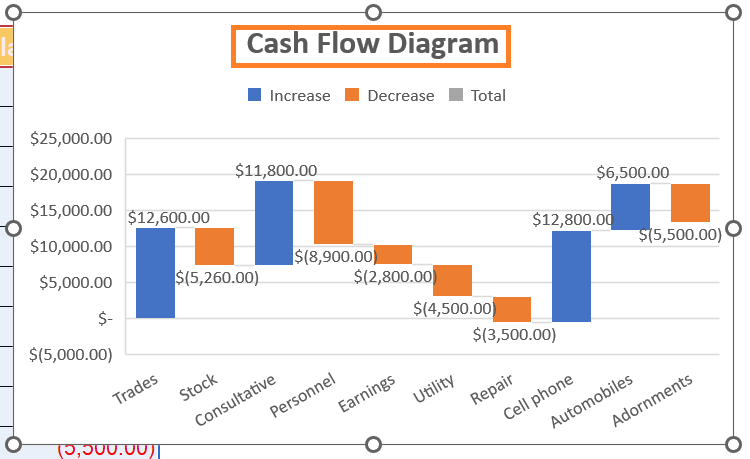
Step 4: Give the Cash Flow Diagram a TitleWe will give the cash flow diagram a title once it has been created. Let's learn by following the guidelines below!
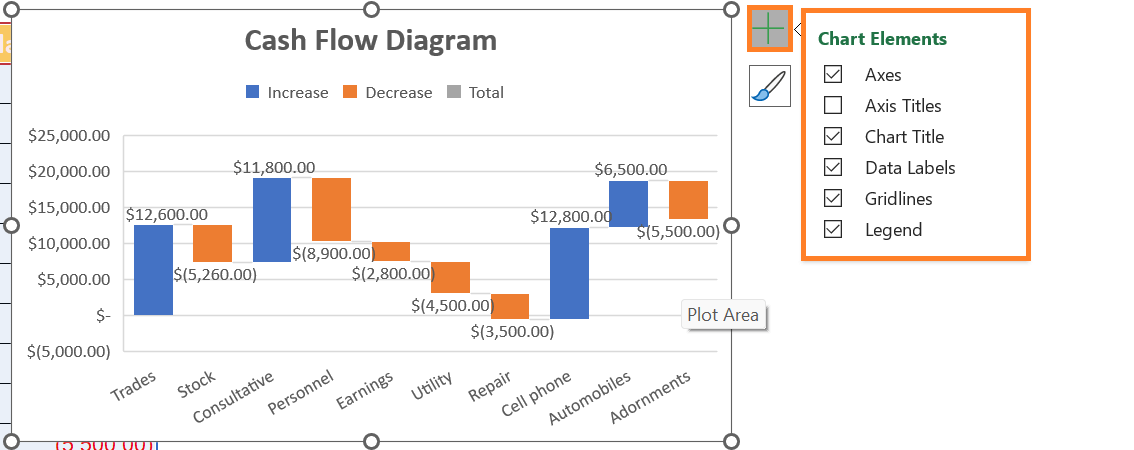
Step 5: Formatting the Cash Flow DiagramWe will now present the cash flow diagram's format. To accomplish that, follow the guidelines provided below.
Calculator for Cash Flow DiagramsThe cash flow diagram can be calculated using the workbook from today. Calculator is the name of a sheet.
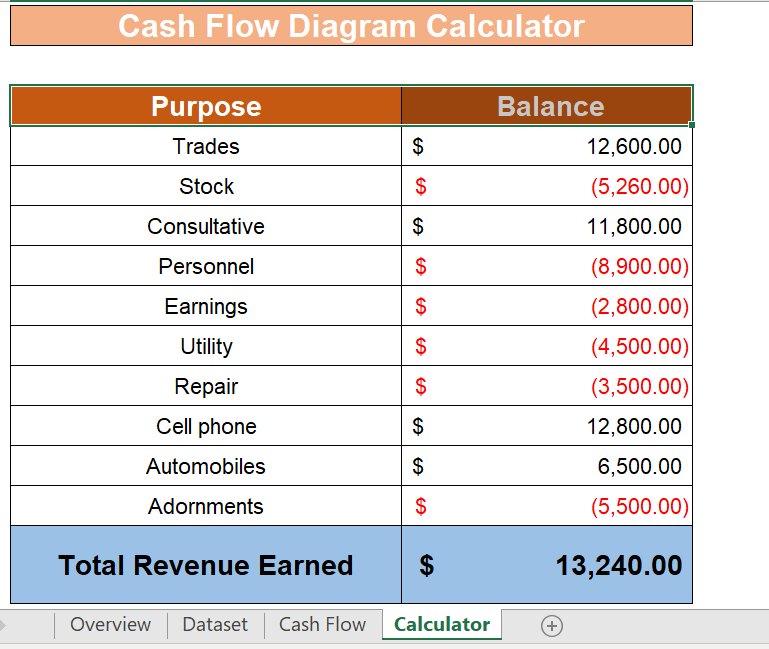
I've provided an example with multiple expense and revenue values. You can enter as many wins and losses as you want.
Next TopicLoan Amortization Schedule in Excel
|
 For Videos Join Our Youtube Channel: Join Now
Feedback
- Send your Feedback to [email protected]
Help Others, Please Share


