| |

MATLAB Pie()This function creates a pie plot. This function determines the percentage of the total pie corresponding to each value of x, and plots pie slices of that size. The optional array explodes controls whether or not individual pie slices are separated from the remainder of the pie. SyntaxExampleOutput: 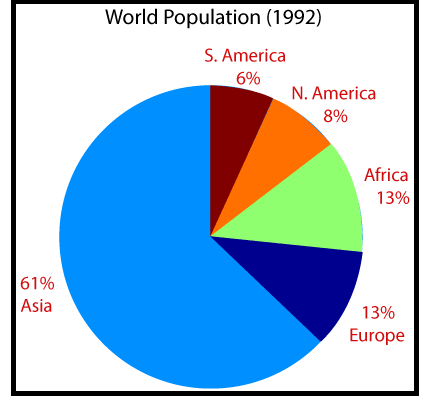
Next TopicMATLAB hist()
|
 For Videos Join Our Youtube Channel: Join Now
Feedback
- Send your Feedback to [email protected]
Help Others, Please Share


Like/Subscribe us for latest updates or newsletter 


