| |
MATLAB Tutorial
MATLAB Tutorial
MATLAB Introduction
Platform & Features
Prerequisites & System Requirements
MATLAB Downloading
MATLAB Installation
MATLAB Online
Advantage & Disadvantage
MATLAB Commands
MATLAB Environment
Working with Variables & Arrays
Workspace, Variables, & Functions
MATLAB Data Types
MATLAB Operator
Formatting Text
Control Statements
if...end statement
if-else... end statement
if-elseif-else...end statement
nested if-else
MATLAB switch
MATLAB Loops
Statement-try, catch
Program Termination
Arrays & Functions
MATLAB Matrices & Arrays
Multi-Dimensional Arrays
MATLAB Compatible Array
MATLAB Sparse Matrices
MATLAB M-Files
MATLAB Functions
Anonymous Function
MATLAB Graphics
MATLAB 2D Plots
MATLAB fplot()
MATLAB Semilogx()
MATLAB Semilogy()
MATLAB loglog()
MATLAB Polar Plots()
MATLAB fill()
MATLAB Bar()
MATLAB errorbar()
MATLAB barh()
MATLAB plotyy()
MATLAB area()
MATLAB Pie()
MATLAB hist()
MATLAB stem()
MATLAB Stairs()
MATLAB compass()
MATLAB comet()
MATLAB contour()
MATLAB quiver()
MATLAB pcolor()
MATLAB 3D Plots
MATLAB 3D Plots
MATLAB plot3()
MATLAB fill3()
MATLAB contour3()
MATLAB surf()
MATLAB surfc()
MATLAB mesh()
MATLAB meshz()
MATLAB waterfall()
MATLAB stem3()
MATLAB ribbon()
MATLAB sphere()
MATLAB ellipsoid()
MATLAB cylinder()
MATLAB slice()
Linear Algebra
Symbolic Mathematics
MATLAB Polynomial
Numerical Integration
Numerical Integration
MATLAB Double Integral
MATLAB Trapezoidal Rule
MATLAB Trapz
MATLAB Simpson's Rule
MATLAB GUI
MATLAB Programs
Environment Programming
MATLAB Variables
Operations on Matrices
Control Statements
MATLAB 2-D Plots
MATLAB Sine Wave Plot
MATLAB Misc
How to Import Audio Files in MATLAB
Importing Video Files in MatLab
MATLAB - Butterworth Lowpass Filter in Image Processing
MATLAB - Ideal Highpass Filter in Image Processing
Image Processing in MATLAB | Fundamental Operations
Morphological operations in MATLAB
Noise Addition Using Inbuilt MATLAB Function
MATLAB Complement colors in a Grayscale Image
Extract bit planes from an Image in Matlab
Image Edge Detection Operators in Digital Image Processing MATLAB
Image Processing - A Tool For Medical Diagnostics
Plot a line along 2 points in MATLAB
Digital Image Processing Basics
MATLAB | RGB Image to Grayscale Image Conversion
Edge Detection Using in-Built Function in MATLAB
Display the Red, Green, and Blue Color Planes of a Color Image in MATLAB
MATLAB | Complement Colors in a Binary Image
Matlab Program to Rotate an Image 180 Degrees Clockwise Without Using Function
fminsearch in MATLAB
Summation in MATLAB
Covariance in MATLAB
Draw Countries Flags Using MATLAB
MATLAB Indexing
Linear fit MATLAB
Ceil Function in MATLAB
Step Function in Matlab
MATLAB limit
MATLAB Inverse Function
MATLAB Count
MATLAB Derivatives
Curve Fitting in MATLAB
Bandpass Filters in MATLAB
F-Zero in MATLAB
MATLAB Unique
Matlab Colon
Matlab Remainder
Permute in MATLAB
Heaviside in Matlab
Kalman Filter Matlab
Low-Pass Filters in MATLAB
Matlab diff
Matlab Errorbar
Matlab Eye
Matlab VPN
Matlab ZPK
Xlabel in Matlab
Matlab Gradient
MATLAB Plot Markers
Squeeze in Matlab
Matlab find peaks
Matlab mesh()
Colors in MATLAB
MATLAB's ezplot
Octave vs MATLAB
MATLAB Quadprog
Matlab randn
MATLAB text()
Matlab nargin
Size Function in MATLAB
Imagesc in MATLAB
Matlab Patch
MATLAB Reshaping
Bessel Function in MATLAB
MATLAB xticks
Matlab ksdensity
Matlab Autocorrelation
Matlab gca
Matlab Secant
Matlab ColorMap
Matlab fft()
Interview Questions

MATLAB Sine Wave PlotObjective: To plot a sine wave of the frequency of 1KHz. Example: Let's generate a simple continuous like sinusoidal signal with frequency FM=1KHz. In order to make it occur as a repetitive signal when plotting, a sampling rate of fs=500KHz is used. Output: 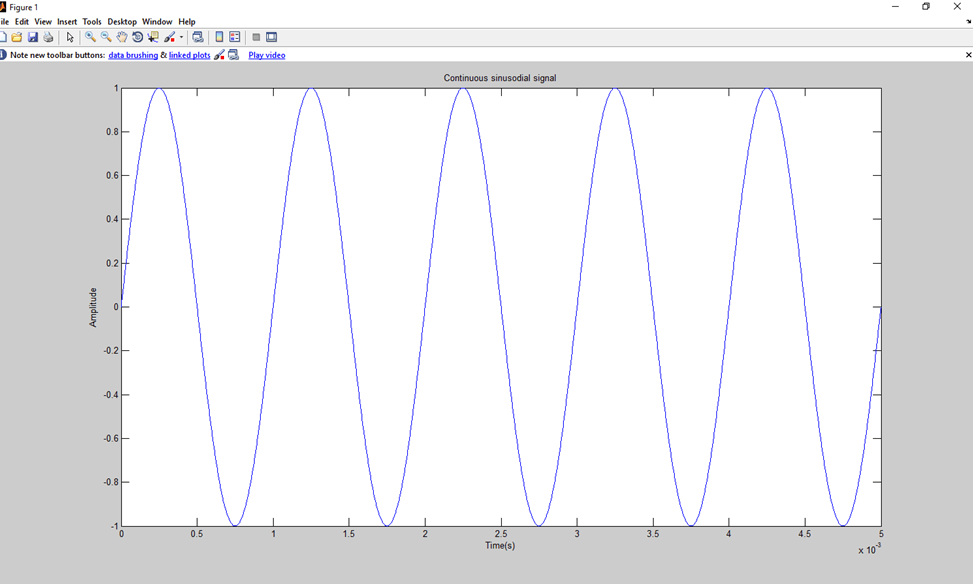
Next Topic#
|
 For Videos Join Our Youtube Channel: Join Now
Feedback
- Send your Feedback to [email protected]
Help Others, Please Share


Like/Subscribe us for latest updates or newsletter 


