| |

Introduction of SeabornWhat is Data Visualization ?This graphical presentation of information is known as information visualisation. Due to the excellent community of Packages focused on information, it is crucial in research methodology. Through summarising effectively displaying a large quantity of data in a straightforward and including how, it also assists people grasp that information, no regardless of how complicated it may be, as well as the quality of the data. It also aids inside the efficient and transparent communication of information. The graphical display of information and data is known as data visualisation. Data visualisation tools offer an easy approach to observe and analyse trends, outliers, & patterns in information by utilising visual elements like charts, graphs, and mapping. Furthermore, this offers a great tool for staff members or business owners to clearly distribute information towards non-technical consumers. To analyse enormous amounts of information & generate information judgments, data visualisation tools and technologies are crucial in the world of big data. Why the value of Data visualization is importantData visualisation is significant because it makes data easier to see, interact with, and comprehend. No of their degree of skill, the correct visualisation can put everyone on the same page, regardless of whether it's straightforward or complicated. It's challenging to imagine a profession sector that is unlikely to gain from better data comprehension. Knowing information is beneficial for all STEM areas, as well as for those in the public sector, business, marketing, history, consumer goods, services, athletics, and others. What is Seaborn?Python's Seaborn package allows you to create statistics visuals. It incorporates tightly with Pandas data structures and has been built upon Matplotlib. You may examine and comprehend their information with Seaborn. Its charting units operate with dataframes including arrays that include entire datasets, and they automatically carry out the semantic mapping and statistical aggregation required to make useful graphs. You can concentrate on understanding what the various components of their plots represent instead of the specifics of how to draw them thanks towards its data source, straightforward API. Seaborn seems to be a fantastic Python data visualisation package that plotting statistically visuals. It offers lovely default styles and colour schemes to enhance the appeal of statistics charts. It is constructed on top of the Matplotlib toolkit and is usually combined with the Pandas data structures. Throughout this lesson, we'll learn how to use Seaborn to create a range of plotting as well as how pair everything with Matplotlib to enhance their visual appeal. 
Line graph - One of the most fundamental plots inside the Seaborn Library seems to be the linear representation. This graphic is primarily utilized to depict uninterrupted information in the manner of something like a response variable. Setting up SeabornInstalling Seaborn onto the PC is necessary before doing so, then I'll demonstrate several installation methods in this article. Pip Installer usageThe de facto new standard for installing and managing Python development tools are called pip. or Utilizing AnacondaThis set containing numerous free software packages are available in the package management, environment manager, and Python distribution known as Anaconda. After installing Anaconda, you can use conda or the management console in Anaconda to load any extra programs that might require. And use this script with in command line, users may also install the development version of Seaborn directly from GitHub. Information Loading for Create Seaborn Plot pointsThe built-in datasets from Seaborn that are acquired immediately during setup will be discussed and summarized. Because you may import anything information utilizing Pandas, utilizing built-in datasets can be especially helpful during using Seaborn. Here's how you can obtain a list of all Seaborn's constructed information. Code - Output: ['anagrams', 'anscombe', 'attention', 'brain_networks', 'car_crashes', 'diamonds', 'dots', 'dowjones', 'exercise', 'flights', 'fmri', 'geyser', 'glue', 'healthexp', 'iris', 'mpg', 'penguins', 'planets', 'seaice', 'taxis', 'tips', 'titanic'] Let's integrate one of those datasets immediately, and during the parts that follow, let us just visualise that information. Code - Output: 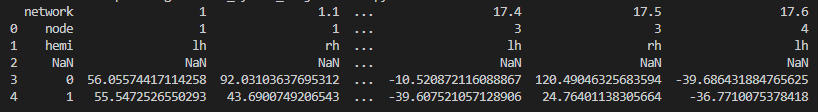
Next TopicNatural Language ToolKit (NLTK)
|
 For Videos Join Our Youtube Channel: Join Now
Feedback
- Send your Feedback to [email protected]
Help Others, Please Share


