| |
Python Tutorial
Python OOPs
Python MySQL
Python MongoDB
Python SQLite
Python Questions
Plotly
Python Tkinter (GUI)
Python Web Blocker
Python MCQ
Related Tutorials
Python Programs

Multivariate Linear Regression in Python"Multivariate Linear Regression" and "Multiple Linear Regression" usually confer the same concept in the context of linear regression modeling. Both terms describe a linear regression version in which you have multiple impartial variables (features) used to expect a single structured variable (target). In different phrases, each phrase means a linear regression version with more than one predictor variable. Linear regression is a crucial device getting to know the method used for predicting a non-stop purpose variable based totally on one or more unbiased features. When we've got more than one unbiased capability, it is called multivariate linear regression. In this article, we will delve into the area of multivariate linear regression and enforce it in Python. Understanding Multivariate Linear RegressionMultivariate linear regression extends clean linear regression to a couple of unbiased variables. Instead of getting in reality one feature (X) to predict a goal (Y), we have numerous capabilities (X1, X2, ..., Xn). The purpose stays the same: to locate the exceptional linear dating of a number of the independent variables and the goal variable. Multivariate linear regression's general formula is: Y = b0 + b1 * X1 + b2 * X2 +b3 * X3 + ……………bn * Xn + ? The goal variable here is Y and X1 , X2 , X3 , X4 , …………Xn are the independent variables, b0 is the intercept, b1 , b2, b3 , b4 , ………..bn are the coefficients, and ? represents the error term. Assumption of Regression Model :
Input code:Output: Coefficients: [0.58539281 1.99996142 2.97306189] Mean Squared Error: 0.09732995265403607 R-squared: 0.9976043742393531 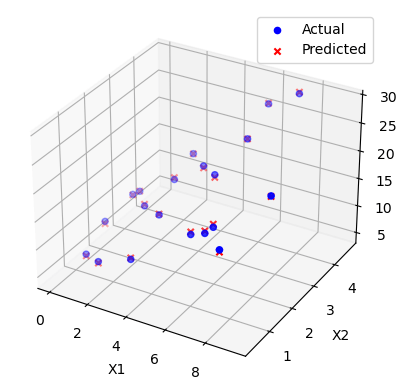
In this code:
This code performs Multivariate Linear Regression the use of numpy and visualizes the outcomes of the usage of matplotlib. Understanding the Outcomes
|
 For Videos Join Our Youtube Channel: Join Now
Feedback
- Send your Feedback to [email protected]
Help Others, Please Share


