| |
Python Tutorial
Python OOPs
Python MySQL
Python MongoDB
Python SQLite
Python Questions
Plotly
Python Tkinter (GUI)
Python Web Blocker
Python MCQ
Related Tutorials
Python Programs

Python Bokeh tutorial - Interactive Data Visualization with BokehIn this article, you will learn how to install Bokeh (and its dependencies) as well as the fundamental building blocks for visualization using Bokeh. Additionally, you'll discover how to design and customize simple plots. What is Bokeh?A Python module called Bokeh is employed to create extremely interactive graphs and visualizations. HTML and JavaScript are used to do this in bokeh. As a result, it becomes a potent tool for developing projects, unique charts, and web-based applications.Bokeh supports a number of plot types, including scatter plots, line plots, bar charts, heat maps, and more. What distinguishes Bokeh from other tools?There are numerous Python libraries available in the visualizations sector for building dashboards and visualizations, such as:
The following are some uses for Bokeh:
It would be best if you read this Bokeh tutorial whether you are a machine learning engineer or data scientist. You must be familiar with Python's fundamental concepts and be able to install and import packages in order to complete this training. You'll discover how to use the Bokeh library to build interactive visualizations and publish them online. You may develop interactive charts, dashboards, and data apps with the aid of Bokeh. It will install each dependency. If every dependency has been installed, pip may be used to install Bokeh from PyPI. In the terminal, enter the following command. Let's make a straightforward plot after installation and learning about the fundamentals of Bokeh. Line Graph :Input: Output: 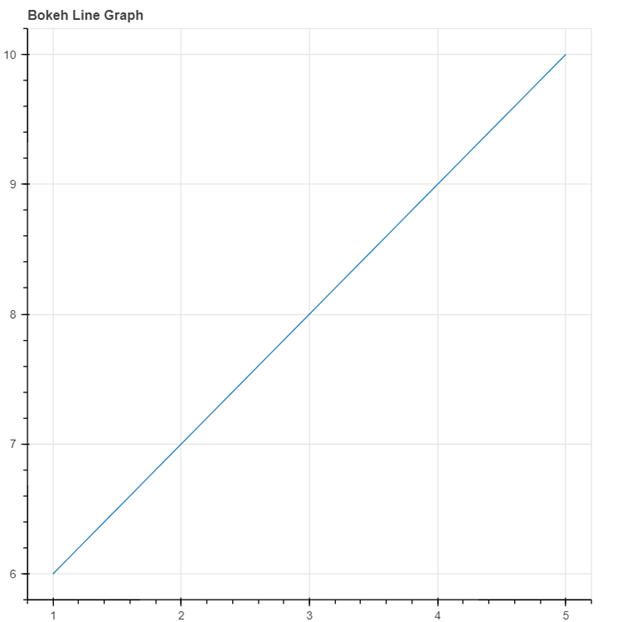
Input: Output: 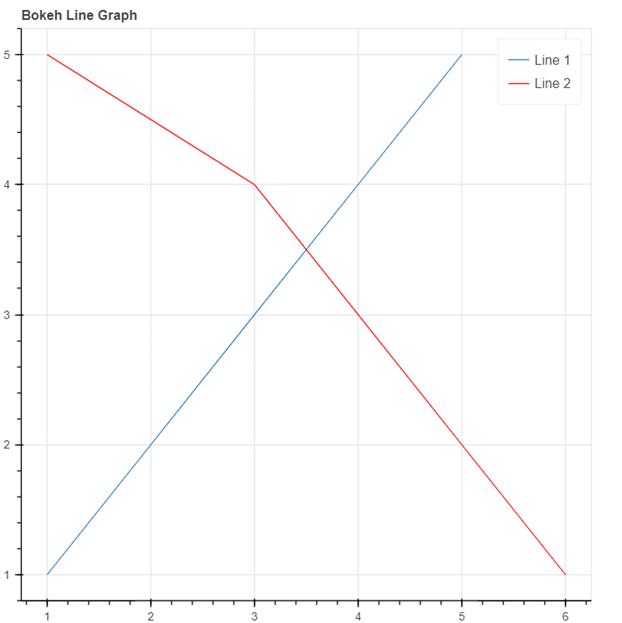
Bar Graph :
Input: Output: 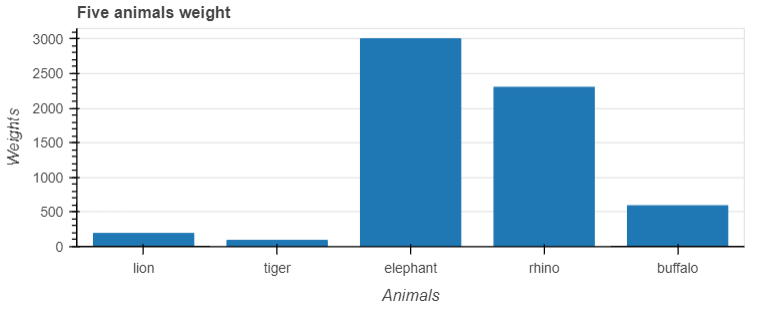
Patch Plot :
Input: Output: 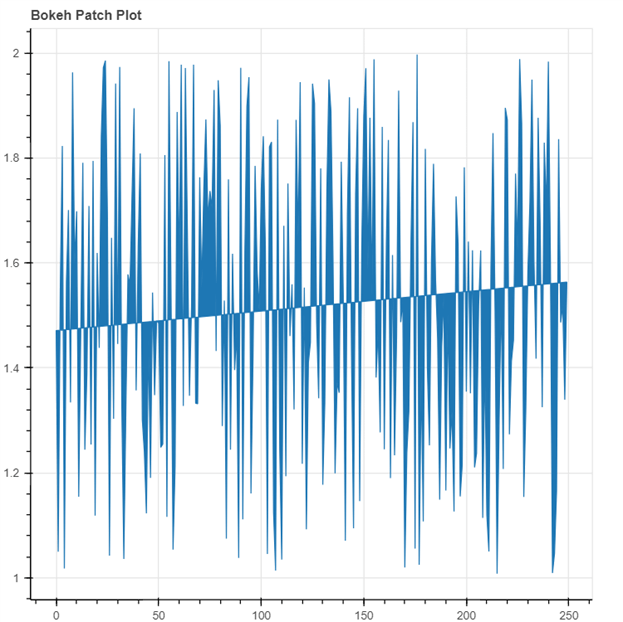
Pie Chart :
Input: Output: 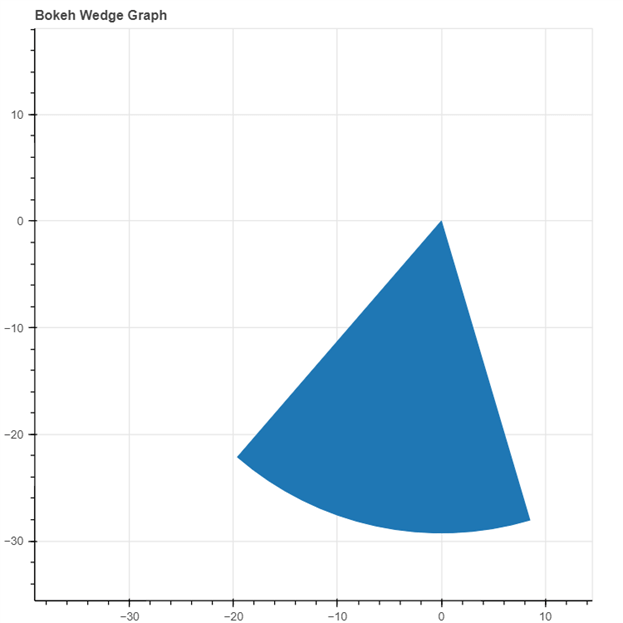
Scatter Plot :
Input: Output: 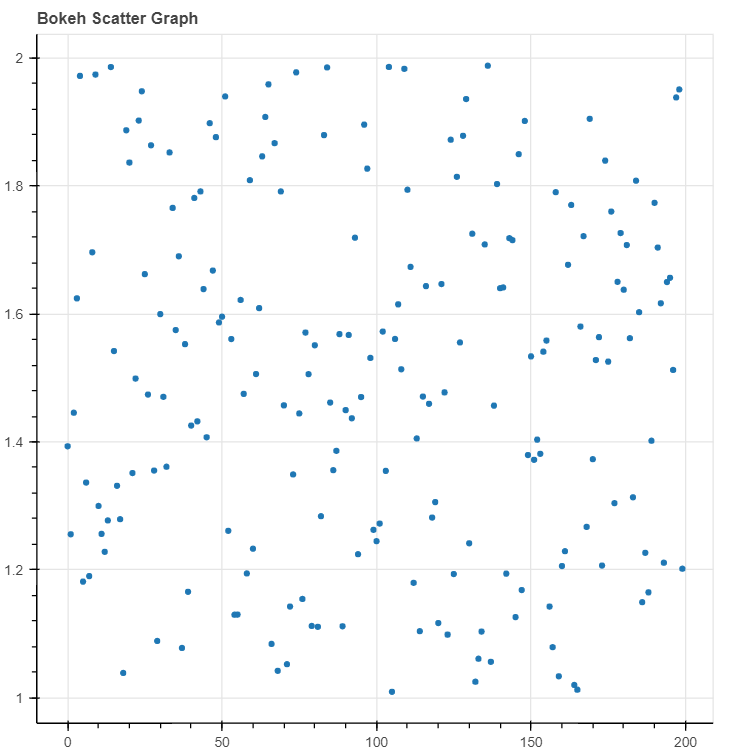
Circle Plot :Input: Output: 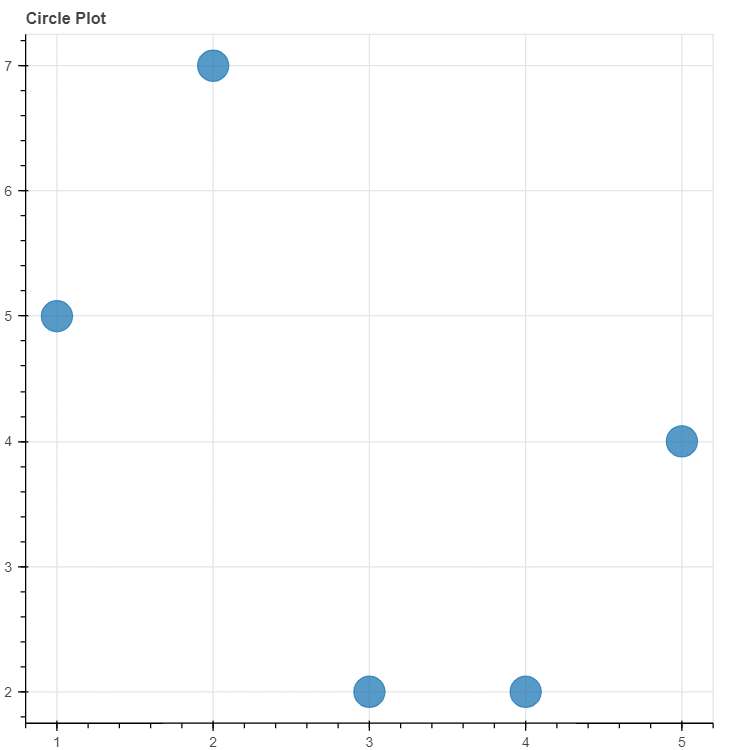
A Python library for building interactive data visualizations is called Bokeh. The fundamentals of making Bokeh plots, personalizing visualizations, and including interactivity have all been addressed in this article. You can explore Bokeh's broad capabilities for creating intricate dashboards and interactive web applications as you grow more familiar with them. |
 For Videos Join Our Youtube Channel: Join Now
Feedback
- Send your Feedback to [email protected]
Help Others, Please Share


