| |

Object Recognition in Medical ImagingIntroduction:In this tutorial, we are learning about object recognition in medical imaging. In the medical field, detecting objects is the challenge of classifying and regressing them. Due to its significant applications in computerized diagnostics and computer-assisted detection systems, researchers are increasing the transfer of the purpose of computer detection in medical applications. The continuous development of deep learning object detection technology in the medical field has been widely used in many diagnostic applications, like detecting the retina of diabetes patients [1, 2], cancer detection earlier, etc. In traditional medical examinations, the appearance of lesions on images is usually detected manually by doctors. This is a time-consuming and challenging task. At the same time, since so many images need to be viewed daily, it is easy to cause fatigue, misdiagnosis, or lack of diagnosis if doctors continue to do this job frequently. Since objects will be detected in small medical images and the machine filters out most of the background information. Then, it accurately identifies small lesions in the image. This is still a significant challenge for object detection in the medical field. What is the Methodology for Object Recognition?Addressing the problems of low resolution, noise, and small objects to be detected in the medical field. The MS Transformer framework aims to give more weight to the object to be detected by filtering the background data in the image. The framework consists of a self-tracking, pre-trained model, a hierarchical Transformer model, and a YOLOv5 head-tracking system. First, this paper divides the input image into several regular blocks and then performs masking on some blocks. After that, we encode the unmasked patch on this basis to obtain the basis distribution of image features. Then, we input the latent feature vectors obtained after coding and the feature vectors without face function into the cutting machine for self-supervised learning to reconstruct the lost pixels of the detecting image. Thus, the model can learn pixel-level semantic features and remove redundant information. The resulting image features are then subjected to a hierarchical transformation and assigned a weight using a sliding window with a local self-tracking system. To distinguish between the two, a higher weight is given to the features of the object to be detected, while a lower weight is given to the features of the background data. Finally, to improve the pattern detection function for medical images, we put the vector image containing intensive care into the YOLOv5 single-object test head, performed the regression function and distribution of the activities of the bounding box to predict, and also the product category. It provides a common cost system that will enable personal use, the bound box and the product's label to be identified with the highest probability. The specific framework of the MS Transformer model is given below. The above image shows that the MS Transformer architecture consists of three parts: the image reconstruction layer, the Swin Transformer, and the YOLOv5. Two transformer blocks consist of the hierarchical transformer. Then, the model and the fully connected box predict the lesion class, and the head of object detection is bounding the box. 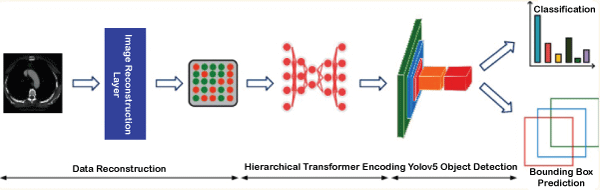
Now we learn about these three parts of the MS Transformer, which are given below - 1. Image reconstruction layer:The image reconstruction layer is the first part of the MS Transformer. This layer is connected to the Swin Transformer. Image reconstruction is done using a self-supervised learning method based on facial recognition. It uses an autoencoder to reconstruct the original signal. Like existing methods, our method has an encoder that encodes the input data and maps it to higher vectors. It also has a decoder that makes decisions on higher dimensional vectors to develop the features of the detecting object. The image reconstruction layer consists of three parts: masking, encoder, and decoder. Masking: It is similar to ViT or Vision Transformer. Here, we first take the medical images and divide them into patches. After that, we compare the images and mask them. Random masks help eliminate the redundancy and let the model learn the depth feature of the images. Encoder: The encoder is a part of the image reconstruction layer. For encoding, we take some patches which are not maskable. We embedded the position vectors leading to the feature vectors into corresponding unmasked patches to reflect the difference between the vectors. After that, the encoder processes them via block transformation. Decoder: Decoder is a part of the image reconstruction layer. It is connected with the encoder. The entire medical image sequence consisting of unmasked data and masked tokens is taken as input in the encoder. Each mask in the image is a vector feature that can be learned to predict and reconstruct missing pixels. We place the position vector of all links into the integrated array of the entire token to reflect the position information in the image like the encoder. Another set of transformer blocks then processes the reconstructed feature vectors of the image. In the below image, we have shown the self-supervised model with the mask mechanism. 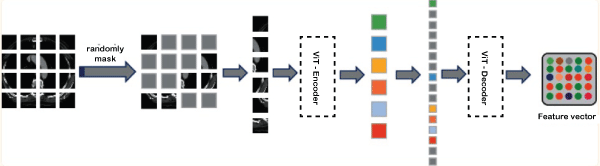
The area of the input image is randomly masked in the image reconstruction layer. Then, the mask is into ViT or vision transformer for encoding and decoding to reconstruct the image by loss function minimization. 2. Self-Attention Mechanism:We introduce a self-attention mechanism to reflect the differences between vectors in different areas of the image and give higher scores to objects to be detected in the image. In medical imaging, the target to be detected is usually limited to a small area. The image contains a lot of noise information, making it difficult for the model to find useful information due to the poor resolution of the image. Therefore, we use a tracking technique to capture the most important information in the input feature vector and give it more weight. We develop the following self-attention function to distinguish the importance of different feature vectors in medical images. Here, we assume that the feature map of the input image is x. Make a feature map of the custom map to get f, g, h and get the vector representation Zi of each area of the image as follows: 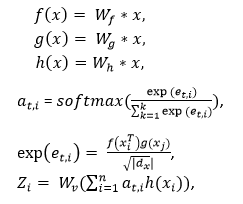
After linear transformation, the feature vector of the feature map x is represented by the f(x),g(x),and h(x). at,i is represented by the similarity between the ith and tth position. Wv is represents the same shape like the feature map x. The dx parameter represents the dimension of the feature map. The parameter Zi represents the final weight. 3. Self-Attention in the local window:To ensure that the model focuses on detecting the small objects. Here, we create a window so that the image is segmented uniformly, and we include a self-attention mechanism so that it does not overlap. It also detects the objects. In an image of size hw, assuming each window has an MM patch. The connection between the global MSA and the computational complexity of the MSA is related to the size of the window. The calculations of this are defined below: 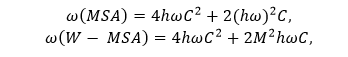
The window-based local attention cannot be connected to other modules across windows, limiting modelling ability. Here, we use the window transformation method to solve the above problems and control the power of the local window. The self-attention window transform method is divided into two modules and used in hierarchical transformer blocks. The window-splitting strategy of the first module is to divide the 8×8 feature map into two large 4×4 windows (M=4). At the same time, the window partitioning or splitting strategy of the second module is the same as the first module. The feature map has divided the window into [M/2, M/2] sizes. 4. YOLOv5 Architecture:The YOLOv5 architecture detects the image in a single stage. This architecture consists of three parts, which are the backbone, neck, and last one is prediction. In the backbone, the mask is used after the self-supervised learning mechanism and the hierarchical Transformer process. We input the extracted feature vectors into the Focus architecture through many CBL, SSP, and BottleneckCSP modules. The CBL module consists of convolutional methods, BatchNorm and LeakyRELU. The convolution layer involves a convolutional neural network with 32 convolution kernels. There, the filter size is 3x3, and the stride is 2. The BottleneckCSP module consists of a cross-stage Partial Network and is mainly used to extract rich semantic information from feature vectors. Unlike convolutional neural networks, this module reduces the gradient information returned during model training. The SSP module has a spatial pyramid function and is often used to extract multiple features. The basis of the network includes integration, support functions, CBL modules and BottleneckCSP modules. YOLOv5 is used to add the FPN + PAN model. The multilingual information is transmitted by the FPN layer from top to bottom. The PAN transmits semantic information from bottom to bottom to the site. During prediction, the model outputs the distribution results of the medical images for any disease and the bounding box coordinates. Discuss how to training the model.Here, we learn about how to train the model for object recognition. Model training can be done using three steps: image reconstruction, lesion attribute classification and bounding box prediction. Now we discuss all these steps below - 1. Image Reconstruction:Firstly, we learn about the image reconstruction. It is a part of the model training. When using the mask self-supervised technique to filter high noise data in medical images. Here we will use the mean square error (MSE Loss) to measure each pixel's difference and pixel reconstruction in the original image. This gap is used to guide the optimization of model parameters. The MSE loss function is defined below - 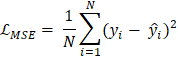
In the above equation, N represents all pixels in each medical image, yi represents the estimated value of the ith pixel value, and y ̂i represents the actual value of the ith pixel in the image. The smaller of the LMSE value means the smaller the difference between the image pixel value predicted by the model and the actual image pixel value. The model can reconstruct the image. According to the MSE loss function, the learning goal of reconstructed image data is to obtain the lowest loss from the predicted value of all samples. 2. Lesion Attribute Classification:Now we learn about the Lesion attribute classification. It is another part of the model training. The data is used as a multivariate classification problem. To classify the lesion classes, we use the loss function, which is cross-entropy. This loss function equation is given in below: 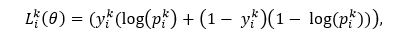
In the above equation, θ is represents as the parameter which can be learn from the network, pik is represents the probability in the kth lesion category, yik is represents as the lesion category's true value and the Lik (θ) is represents the better model's prediction by its small value. 3. Bounding Box Prediction:Now, we learn about the bounding box prediction. It is the last part of the model training. To complete the regression function of bounding boxes for object detection, we use Intersection on Union (IoU) for our loss function here. It is the ratio of the intersection of the area between the real and the predicted boxes. The formula for boundary box prediction is given below: 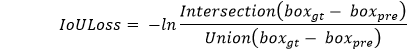
In the above equation, the real box is represented by the parameter boxgt and the predicted box is represented by the parameter boxpre. The smaller value of the IoULoss have a closer connection between the ground real box and the prediction box. Experiment of the object recognition in medical imaging:Here, we experiment with the process of object recognition in medical imaging, which is done by a few steps, which are discussed in below - 1. Implementation details:We use the MS Transformer model based on the Python programming language 3.7 and the PyTorch deep learning 1.8.0. On the RTX3090 GPU hardware model, all the network training and testing procedures are performed. We divided it into the training, verification, and testing processes with a balance of 70%, 15% and 15%, respectively. Then, we also set 32 as a batch size. Then, we randomly initialized the weight of all layers in our network. To optimize the network weight, we used here Adam [38]. The learning rate is set as 1e-4. We take the maximum number of the network to 500 so that the model can be fully trained. At the same time, to improve the overall ability of the model of the experimental system. We regularly adjusted the output and L2 weights as 0.5 and 0.0005, respectively. 2. Used Dataset:In this tutorial, we used the DeepLesion. The NIHCC team creates the world's largest CT imaging dataset and clinical history to record hospital-collected data. This information has supported the development of computer-aided diagnostic technology and computer-aided detection technology in the medical domain. The database contains 10,594 CT studies of 4,427 patients and 32,735 annotations on 32,120 axial slices. The DeepLesion dataset includes many disease types, unlike most existing databases. It also includes lung nodules, bone lesions, kidney disease, etc. They all have a small diameter range from 0.21mm to 342.5mm. In this case, the small diameter of the object to be detected and the large class that needs to be recognized make it difficult to detect a lesion. In this article, we evaluate the model's performance on this data. The distribution of training methods and validation are specified in this benchmarking dataset, along with the number of categories to be defined and the evaluation metrics are given below in table -
A BCDD dataset of a blood sample containing 4,888 blood cells. BCDD data is divided into three categories: WBC or white blood cells, RBC or red blood cells and Platelets, and each image has a label. This data includes images of 4,155 white blood cells, 372 red blood cells and 361 platelets. The size of each image is 416 × 416. This article will use the BCDD dataset as another test data for our experiments. The distribution of training methods, testing methods and validates in this test file and the number of groups to be analysed and measured. All of these are shown in the above table. 3. The baseline of the model:For object recognition, we have used the model's four baselines: Faster R-CNN, Mask R-CNN, Fast R-CNN, DETR, and Swin Transformer. Now we learn about these below - a. Fast R-CNN: The Fast R-CNN model was proposed by Girshick et al. It uses spatial pyramid pooling to extract features from candidate frames. The resulting features are then mapped into feature vectors of fixed length. However, this model has limitations and a slower detection speed as it uses the same method as R-CNN when selecting candidate frames. b. Faster R-CNN: The Faster R-CNN model proposed by Ren et al. This model is different from the Fast R-CNN model. It uses the RPN network to extract candidate frames and then uses the ROI pooling process to combine the size of the maps corresponding to the candidate frames. Finally, classification and regression are performed on the candidate frames. This model increases the detection rate and is an end-to-end model. c. Mask R-CNN: The Mask R-CNN model proposed by He et al. It is used to detect different sizes of objects. The model uses the RPN network to extract various features. ROI Alignment transforms the feature map to reduce the difference between the object and candidate frames. This model was better received than the above two models due to its good result. d. DETR: The DETR model proposed by Carion et al. It treats the object search function as the prediction function of the combination. DETR uses the Transformer architecture to encode and decode input maps and output a composition of predicted limiting positions. This model does not need to be returned before the candidate frame. The performance of DETR is greatly improved. e. Swin Transformer: The last method name for baseline is Swin Transformer. This model is proposed by Liu et al. It can be used as a backbone for the detection of the object. This model brings self-attention to a sliding window and limits it to a local window. It causes the model to assign more weighted scores to the object that must be detected. 4. Metrics evaluation:To verify the DeepLesion dataset and the MS Transformer model's effectiveness, we must evaluate the matrices using accuracy, AP50, and mAP. a. Accuracy: Accuracy checking is one of the processes of metrics evaluation. The formula for accuracy is given below - 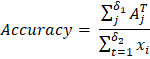
Here δ1 and δ2 is represents the number of datasets sample in the testing dataset and corrected number of samples respectively. The ith lesion sample is represented by the xi parameter. The jth lesion sample's correct prediction is represented by the AjT. If the accuracy value is large, then this represents that the model is giving a good performance. b. AP50: AP50 checking is one of the processes of metrics evaluation. The formula of AP50 is given in below - 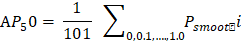
In the above equation we learn the formula of calculating AP50. This formula is depended upon few parameters like 1/101 and Psmooth i. Here 101 means the interval range of [0, 1] divided by 100 equal points on the horizontal axis. The parameter Psmooth i is represents the smooth PR curve precision in the ith point. The IoU threshold of 0.5 is represents by the parameter AP50. The higher the AP50 value is represents the bounding box predicted by the model at the most accurate coordinate position. c. mAP: mAP checking is one of the processes of metrics evaluation. The formula of mAP is given in below - 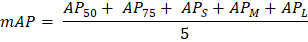
In the above equation we learn the formula of calculating mAP. This formula is depended upon few parameters like AP50, AP75, APS, APM, and APL. When the IoU threshold value is 0.5 then this is represented by the parameter AP50. When the IoU threshold value is 0.75 then this is represented by the parameter AP75. The AP value of a target frame with a pixel area of less than 322 is represent the parameter APS. The parameter APM is represent the AP value of a target frame with a pixel area which must be lies between 322 to 962. The parameter APL is represent the AP value of a target frame with a pixel area which must be greater than 962. 5. Results:Now we learn about the result of the object recognition, which we have given in below - a. Difference between the BaseLine and the State-of-the-art: This tutorial compares the proposed MS Transformer model with existing mainstream and current state-of-the-art DETR models. In the experimental results show that the model proposed in this article to improves the performance of the prediction box and the recognition accuracy of the disease group of the DeepLesion benchmark dataset. In the dataset of DeepLesion, the recognition accuracy of this model is 90.3%, which is 3.6% higher than DETR; The mapped value is 89.6%, which is 1.8% higher than DETR. Here the experimental results show the effectiveness of our model. Lesion type recognition accuracy and bounded box prediction AP values obtained from MS Transformer and other models based on the DeepLesion dataset are given in Tables 2 and Table 3. Table 2: Here, we give the dataset of DeepLesion.
Table 3: Here, we give the dataset of MS Transformer. 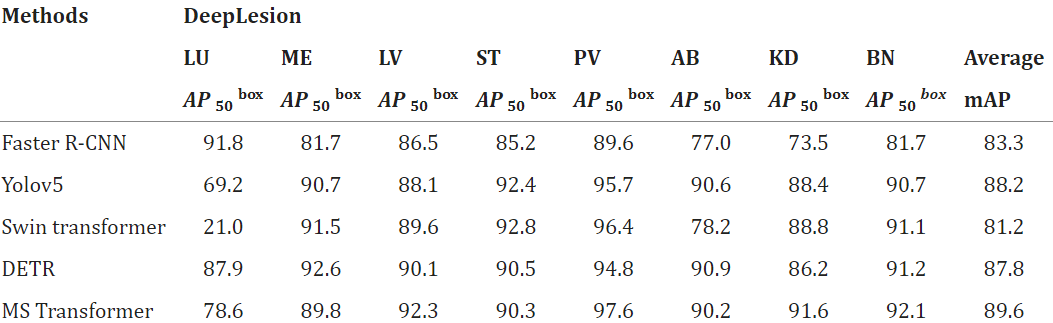
We also tested the MS Transformer and other test models on BCDD test data. Experimental results show that MS Transformer successfully improves the performance of cell location prediction and recognition of cell category. As seen in Tables 4 and 5 of the BCDD dataset, the average recognition accuracy of MS Transformer is 96.15%, reaching the average recognition accuracy. Then the table 4 and table 5 are given in below - Table 4: Here, we give the dataset of BCDD. 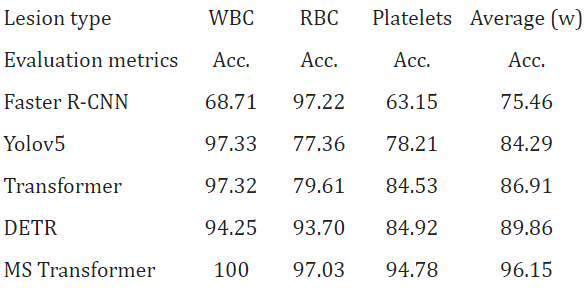
Table 5: 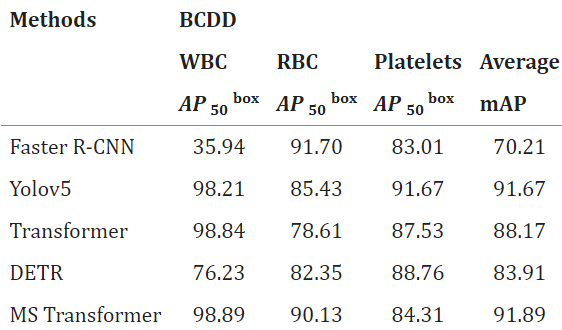
Compared with the baseline model, MS Transformer can achieve better performance in DeepLesion and BCDD data analysis due to the different implementations of the model. The models mentioned in this article focus mainly on the purpose of object detection in the medical field. For the low resolution of medical images, many small elements are to be detected, inaccurate information is given, and more weight is given to small objects. The current state-of-the-art DETR model ignores the image resolution issue, even though it is developed in the existing mainstream framework Transformer and can obtain the dataset results. b. Ablation Study: The innovation of our MS Transformer model combines the masking process and the transformer hierarchical model. We performed ablation experiments on the DeepLesion benchmark dataset by removing one module at a time to examine its impact. The results of the ablation test are shown in Table 6, which is given below -
Experimental results show that the hierarchical Transformer has more impact on the model than the mask; only using the mask for object detection will make the model more accurate, with a loss of 15.6% and 16.1%, respectively. mAP rate reduction percentage. Using a local self-attention window in hierarchical transformers helps the model give more weight to small objects to be detected, thus helping to identify the detection of objects accurately. We also performed ablation experiments with different masking levels and tested masking from 10% to 80%. In the below diagram, we have shown that when the mask value is between 10% and 30%, the recognition accuracy of the model is close to each other, and the accuracy of BCDD and DeepLesion benchmark data clocks are about 86% and 82%, respectively. When the nominal value reaches 40%, the recognition model starts to increase the accuracy, with an accuracy of 94.3% and 87.1%, respectively. 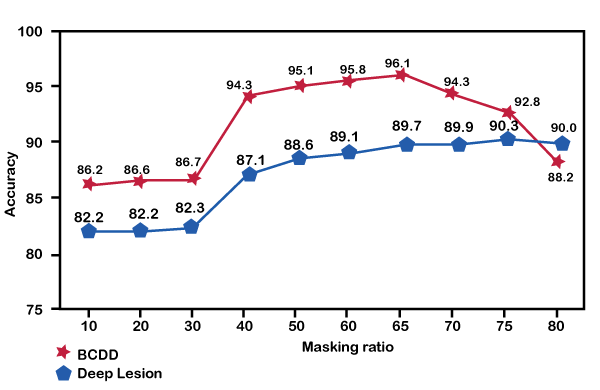
Conclusion:In this tutorial, we are learning about object recognition in medical imaging. Unlike existing studies, the proposed model provides better results by considering low resolution, noise, and small objects to be detected in the medical field. Compared with existing works, the proposed model improved performance on the DeepLesion benchmark dataset. |
 For Videos Join Our Youtube Channel: Join Now
Feedback
- Send your Feedback to [email protected]
Help Others, Please Share


