| |

CPU Utilization in LinuxOne aspect of determining the system's efficiency is CPU performance. Monitoring CPU performance is critical to debugging system processes, making system decisions, handling system resources, and inspecting and evaluating systems in real- time. A variety of tools are available to track and view CPU performance. The operating system consists of built-in system calls that rely on these tools to extract performance readings. Now we talk about the great CPU usage monitoring tool and how to use it in any Linux distribution. Used Top to Check CPU UtilizationWith the help of the top command, we can monitor the system in real-time. When we execute the top command, it will provide us the summary of the system along with the list of threads and process which are presently being managed by the Linux kernel. It also offers various options in order to change its behaviour and perform several actions. Syntax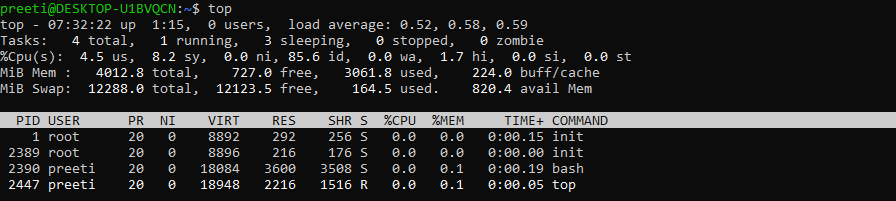
In the above output, the main line to focus on is the line number third. The output values are briefly described. Each value indicates how much time the CPU spends performing a task.
Check CPU Utilization Using htop CommandThe top and htop commands are the same. In terms of system monitoring both commands offer the same functionality. On the other hand, the htop command offers a better quality-of-life experience. The htop's default display is more user-friendly. As compared to the top, the htop UI has better quality. In this, we can also scroll horizontal as well as vertical. In most of the distros, the top is installed by default, and we have to install the htop manually. The best way to install the htop is using snap because it works well on any of the Linux distros. Following is the syntax which we use to install htop: Syntax of htop: 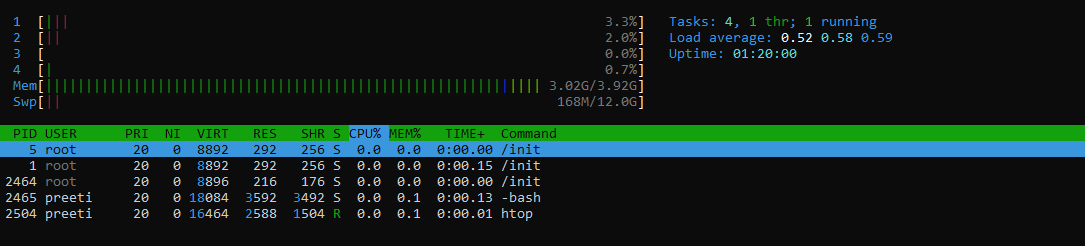
Check CPU Utilization Using iostatThe iostat command reports CPU and I/O usage statistics. This command is simple with simple output. Although, it will only report data on the moment the command was run. iostat does not provide real-time system monitoring, unlike top and htop. The iostat tool comes as a part of the sysstat package. Mostly this command is available on every Linux distro. Suppose we have installed the sysstat package, then run. Launch iostat: 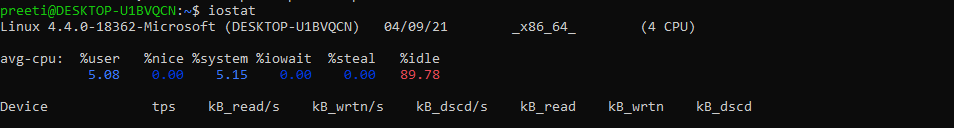
If we want to know more detail, then we can use the -c flag to check the CPU usage of system processes, I/O wait, idle time, and user processes. Syntax 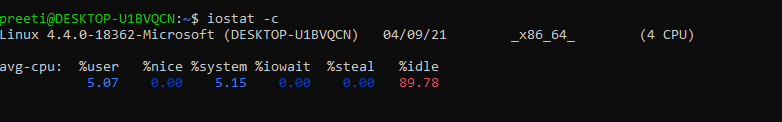
The "-x" flag can be used to get more details statistics. The "-t" flag specifies the number of times each report must be shown. 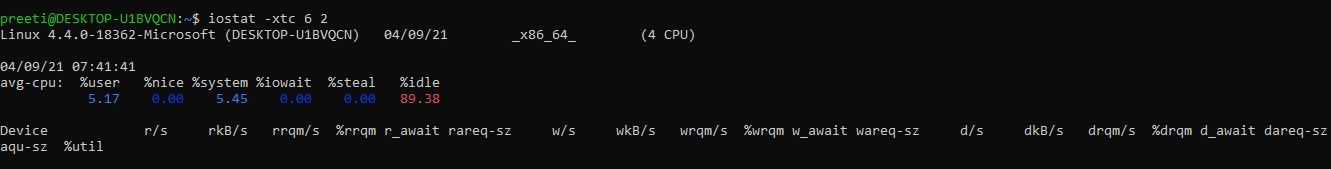
Use mpstat to Check CPU UtilizationThe mpstat tool is a part of the sysstat package. The tool reports the use of an individual processors or processor cores. If we want to use the mpstat command, then it is a must that the sysstat package is installed in our system. Let's say we already have the package installed then proceed. Launch mpstat: 
Now we will explain each value in detail, and each value defines the usage of CPU at a specific stage.
Use sar to Check CPU UtilizationUsing the sar command, we can gather and report system activity information. This command will provide you a simple and short report related to CPU utilization. Sar command may also be used to provide the CPU information at a regular interval (in seconds). It is not a real-time report; it is still better to work with it. We are also able to define the number of times the sar will print the output. In this below example, the sar will print the output at 4 seconds intervals, for 8 times. 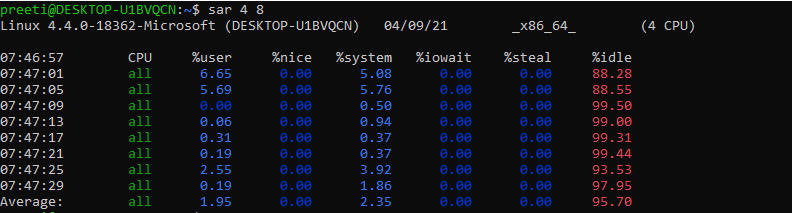
Check CPU Utilization Using nmon Commandnmon is a system administration tool that we used to get the information about CPU, Top process memory, etc. We can install the nmon command by using the following command: 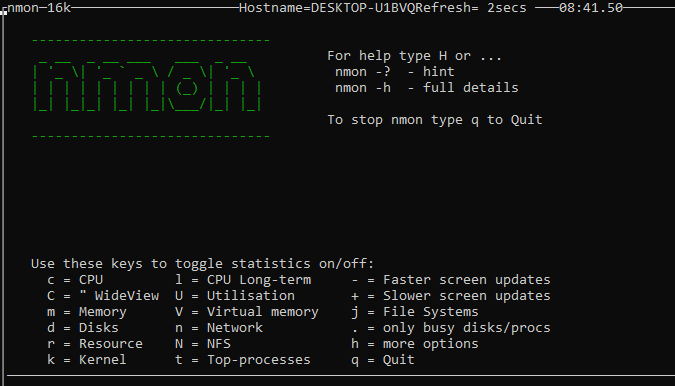
Next TopicLinux Terminal
|
 For Videos Join Our Youtube Channel: Join Now
Feedback
- Send your Feedback to [email protected]
Help Others, Please Share


