Chebychev's Inequality in Excel
We can assume that, for normal distributions, around 68% of the data is within one standard deviation of the mean. Moreover, we know that two standard deviations of the mean will contain roughly 95% of the data in a normal distribution.
For a dataset that deviates from a normal distribution, how can we determine the ratio for results inside a given range?
- Chebyshev's theorem is a universal rule applicable to all conceivable data sets. You can use the theorem to determine the percentage of observations within a given range.
- According to the theory, the fraction of observations for every given population/sample must be at least (1 - (1/k2)).
- Let us examine an instance where the Chebyshev Theorem can be applied to determine the quantity of data inside a specified range surrounding the mean.
- Assume you have 1000 values in your dataset. 267 is the standard deviation, and 586 is the population mean.
To what extent does a result deviate from the mean by one standard deviation?
- Making the equation into a unique Excel formula allows us to apply Chebyshev's Theorem in Excel.
- The amount of standard deviations deviating from the mean that your range will cover, k, is all that needs to be replaced.
- Excel functions can be utilised to ascertain the standard deviations required for utilising Chebyshev's theorem to discover the outcome in cases where the beginning and end of the range are specified.
- After learning when to use Chebyshev's theorem, let's see how to apply it to a real-world example spreadsheet.
A Real Case Study of Applying Chebyshev's Theorem in Excel
Several examples of using this function are given in the next section. Additionally, we will describe the tools and formulas utilised in these cases.
Firstly, let us examine a sample problem for which the solution can be found using Chebyshev's theorem.
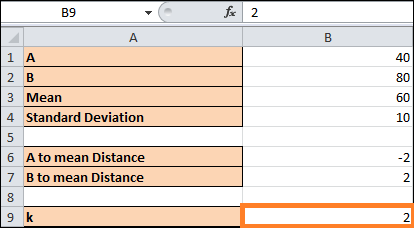
- Let's say you have a population with a mean value of 60 and a standard deviation value 10. You wish to determine the proportion of results between 40 and 80.
- We must first determine the value of k to use Chebyshev's theorem. By dividing the result by the standard deviation, we can determine how much A and B deviate from the mean.
Using the formula below, we determined the distance through the mean:
- Given that the absolute value of both distances is 2, we may determine that our k is also 2. Using Chebyshev's theorem, we will utilise the value of k to figure out our percentage.
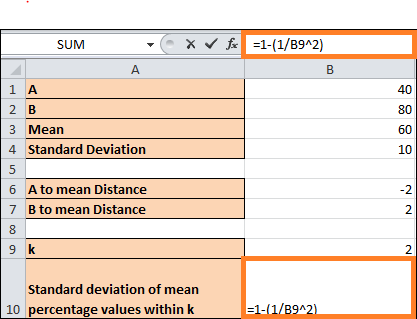
The percentage of values within a k standard deviation of a mean may be found using the following formula:
Want to examine our examples in more detail? If you're ready to attempt using Chebyshev's theorem on your own, go to the next part and follow our detailed instructions to create a duplicate of the spreadsheet using the link below!
The Chebyshev Theorem: How to Use It with Excel
The procedures to implement Chebyshev's theorem in Excel are explained in detail in this section. The start and finish of a range surrounding the mean and how to calculate the value of k will all be covered.
We'll apply a method to determine the percentage of data that should lie inside k standard deviations of the mean once we've determined k.
The Chebyshev theorem In Excel can be used by following these steps:
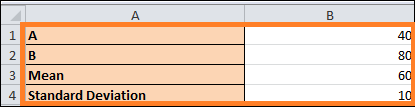
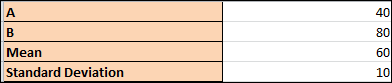
- To determine the value of k, first, make a table with the values we'll need. Values A and B indicate the beginning and end of the range that we wish to apply Chebyshev's theorem to in this example. The population's standard deviation and mean are also recorded.
- Using the formula (B1-B3)/B4, we will get point A's distance from the mean. The formula's result is a number of standard deviations from the point that deviates from the mean.
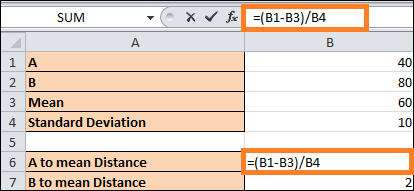
- We shall apply a similar formula to determine B's distance from the mean.
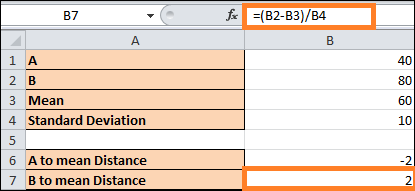
- Given that our range begins and ends two standard deviations outside the population mean, we can set k to 2.
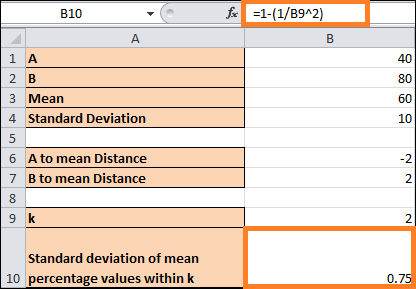
- The percentage for values between k standard deviations for the mean will be obtained using the formula =1-1/B9^2.
- Press the Enter button to assess the outcome. According to our findings, approximately 75% of the population in our example falls within two standard deviations of the mean.
To implement Chebyshev's theorem in Excel, follow these instructions.
|

 For Videos Join Our Youtube Channel: Join Now


