| |

Excel SeriesOver the years, Microsoft Excel has undergone multiple editions, each bringing new enhancements and capabilities. Enhancements were made to the user interface, performance, and usefulness with every release. Every version of Excel, from its modest beginnings in 1985 with the release of Excel 1.0 for the Apple Macintosh to its most recent incarnations as part of the Office 365 package, has had a profound impact on the fields of computation, data analysis, and visualization. Excel will undoubtedly continue to evolve to meet users' changing needs going forward, upholding its position as a vital tool for both individuals and companies looking to fully use data. VersionsThe different versions are as follows: Excel 1.0
The initial release of Microsoft Excel in 1985 marked the start of what would eventually become one of the most widely used spreadsheet applications globally. Adding a graphical user interface helped it stand out at a period when much spreadsheet software was command-line interface only. The ability of Excel 1.0 to support a multi-window environment was impressive. Even in its initial iterations, Excel featured basic charting and graphical elements. Despite being simple by today's standards, Excel 1.0 had a big influence on the development of spreadsheet software. When Excel was first released, personal computers were becoming more and more popular, and the Apple Macintosh's graphical capabilities made it the perfect platform for Excel's graphical user interface. The feature set of Excel 1.0 was somewhat small when compared to more recent versions. Excel was distinguished by the addition of a graphical user interface, which also hinted at the future direction of spreadsheet software. Excel 1.0 is remembered for being the first spreadsheet programme to use graphical user interfaces. Excel 1.0 made use of the Macintosh operating system's features since it was created for the Apple Macintosh. Excel 2.0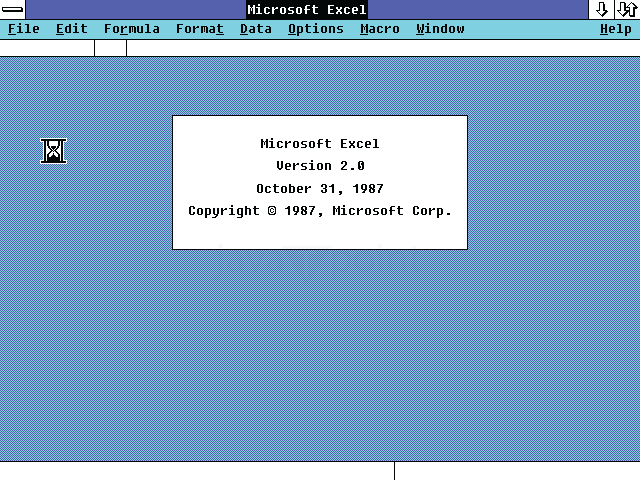
Building on the groundwork established by its predecessor, Microsoft Excel 2.0 marked a major advancement in spreadsheet software development when it was first published in 1987. The choice to adopt Windows demonstrated Microsoft's dedication to remaining at the forefront of technical advancements, given the growing significance of the Windows operating system in the computer industry. Excel 2.0 improved upon previous versions of the program by adding new features that catered to the changing needs of spreadsheet users. The product promoted a more integrated office suite experience by offering better compatibility with other Microsoft Office apps. Excel 1.0 introduced the .XLS file format, which was further refined, and compatibility requirements were established in Excel 2.0. Excel 2.0 improved productivity for people working with complicated information by enabling users to work with numerous spreadsheets at once with its multi-window environment. Because Microsoft used an iterative development process, every version built on the achievements of the one before it, resulting in a continual progress trajectory, Excel's future growth was made possible by the development of its interoperability across platforms, its functional improvements, its enhanced user interfaces, and its greater file compatibility. Excel 2.0's introduction of dynamic data-sharing features was a major advancement in enhancing inter-application communication. Excel 2.0 included support for external databases, expanding its capabilities beyond simple data manipulation. Excel 4.0
The 1992 introduction of Microsoft Excel 4.0, which demonstrated the company's dedication to innovation and adapting to consumers' changing needs, is recognized as a turning point in the development of spreadsheet software. A notable characteristic of Excel 4.0 was the addition of VBA-based macro capability. Excel 4.0's macro features made it possible for users to record and replay their actions inside the programme, automating processes without requiring a deep understanding of programming. Interface improvements included in Excel 4.0 made the programme easier to use and more intuitive. Excel 4.0's increased number of built-in functions increased the program's analytical potential. By adding the option to link straight to external databases, it also improved its connections with outside data sources. With additions that let users produce more complex and eye-catching charts, Excel 4.0's charting capabilities continued to advance. The foundation for Excel's interaction with other Microsoft Office programmes was established by Excel 4.0, which also paved the way for a more unified and integrated set of productivity tools. The fact that VBA is still used for automation, that Excel has advanced analytical features, and that Excel is still widely used for data manipulation and analysis are all indications of Excel 4.0's legacy. Excel 7.0
The 1995 introduction of Microsoft Excel 95, commonly referred to as Excel 7.0, was a major turning point in the development of spreadsheet software. Excel 95 marked a significant advancement in terms of capability, user interface design, and connection with other Microsoft Office applications, in addition to carrying on the innovative trend started by its predecessors. The user interface was significantly improved in Excel 95, bringing with it the now-familiar toolbar and menu system. With this feature, several users may work together on the same workbook while highlights and changes were logged. Excel 95 strengthened its compatibility with other Microsoft Office programmes, promoting a smooth user experience throughout the suite. With the help of VBA 5.0's rich programming environment, users could build unique Excel solutions, automate challenging operations, and create sophisticated macros. Excel 95 made enhancements to the File Open dialogue box, providing users with a more user-friendly and productive interface for navigating and opening workbooks. The change from Excel 5.0 to Excel 95 signified a move in the direction of language support and internationalization. The fact that Excel is still used as a standard for data analysis, visualization, and automation in the rapidly changing field of modern computing is clear evidence of Excel 95's legacy. Excel 8.0The constant improvement of Excel 97's user interface was one of its most notable characteristics. A few new charting features included in Excel 97 allowed users to produce more visually engaging graphics. Microsoft's emphasis on interoperability within the Microsoft Office suite was demonstrated by the change from Excel 95 to Excel 97. Excel was positioned as a flexible platform for both casual users and developers looking for advanced automation and customization capabilities thanks to the ongoing integration of VBA. The Excel Web Query served as a prototype for later advances in web-based data integration technologies. Excel 97 represented a major advancement in language support and internationalization. Excel 97 included the Data Form feature, which further cemented the program's standing as a robust and adaptable spreadsheet program. Excel 97's enhanced PivotTable feature was a major breakthrough in data analysis capabilities. For users who want to communicate information in a standardized and understandable way, custom number formats have become an invaluable tool. Excel 97 also made use of the internet's developing capabilities by introducing the option to store workbooks as web pages. Excel 2000 (9.0)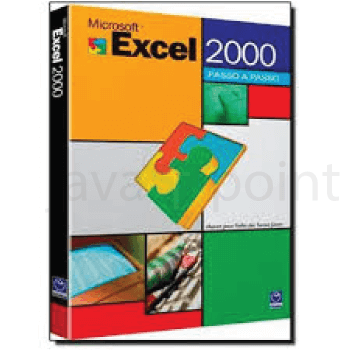
Microsoft Excel 2000 was a substantial advancement in spreadsheet software, expanding upon the foundation set by its predecessors while offering a plethora of new features and refinements. It was introduced in 1999 as part of the Microsoft Office 2000 suite. With the release of the Analysis ToolPak, Excel 2000 placed a strong emphasis on enhancing data analysis capabilities. Excel 2000's Chart Wizard was improved to give users additional choices and flexibility when making eye-catching visualizations. Excel 2000 brought capabilities to enhance document sharing and collaboration in response to the growing popularity of digital collaboration. Excel 2000 added the Goal Seek tool, which increased the program's capacity to tackle challenging issues. Excel 2000's AutoComplete feature lets users save time by anticipating and filling in text entries based on previously entered data. The Print Preview tool was added to the software to reflect the latest developments in printing technology. Workbook protection was enhanced by Excel 2000 in response to the growing significance of data security. With the release of the Accessibility Checker in Excel 2000, Microsoft demonstrated their dedication to accessibility. The goal of the Research Task Pane was to make information collection and research more efficient without requiring the use of outside programs. Excel 2002/XP (10.0)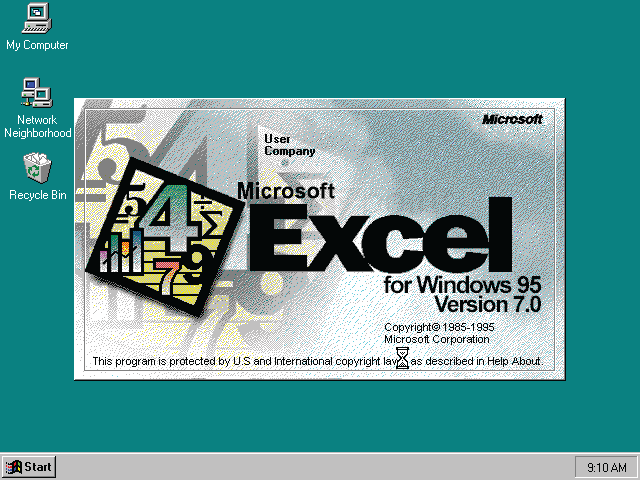
Another important milestone in the development of spreadsheet software was reached with Microsoft Excel 2002, also referred to as Excel XP and included in the Microsoft Office XP suite. The Task Pane, a dynamic and context-sensitive interface that gave users instant access to frequently used commands, formatting choices, and tools, was one of the noteworthy improvements added to Excel 2002. Since its introduction in Excel 2002, Smart Tags have developed to offer users links to more information and context-sensitive actions. Excel 2002's integration of SharePoint Team Services improved collaboration. Excel 2002 introduced XML support, enabling workbooks in XML file formats to be saved and opened by users. The enhanced performance and stability of Excel 2002 was one of its most notable improvements. Additionally, smart tags-a feature intended to improve user engagement with data-were introduced in Excel 2002. Another area where Excel 2002 saw significant advancements was collaboration. A structured table called the ListObject was first introduced in Excel 2002 and made data organisations and manipulation easier. Additionally, Excel 2002's PivotTable feature was improved, giving users additional choices for data analysis and summarization. Excel 2002 incorporated the recognizable menu and toolbar design that was a hallmark of Microsoft Office at the time, both in terms of user interface and aesthetics. Excel 2003 (11.0)The List Object, which expanded on the Excel Tables concept first introduced in Excel 2002, was one of the most notable additions to the software in Excel 2003. Excel 2003 introduced the List Formula tool, further enhancing its data analysis capabilities. Excel 2003 improved XML support by adding XML Mapping in response to the growing significance of XML as a standard for data sharing. Excel 2003's Smart Tags offered users dynamic access to more details or actions depending on identified data. Excel 2003 introduced enhanced support for SharePoint integration, which helped the programme advance significantly. Microsoft furthered their accessibility priority in Excel 2003 with the release of the Accessibility Checker. Notable advancements were made to Excel 2003's PivotTable functionality, which improved users' capacity to analyse and present data in a more dynamic and interactive way. List Search was first introduced in Excel 2003 and allows users to easily search and filter data inside a List Object. To increase the accuracy and transparency of spreadsheet computations, the software also provided Formula Auditing tools. Excel 2003 included digital signatures as a solution to the growing concern over document security. With the release of Excel 2003, the program made further improvements to its user interface by adding new toolbar and menu designs. Excel 2007 (12.0)The introduction of Microsoft Excel 2007 as a component of the Microsoft Office 2007 package revolutionized the field of spreadsheet software. The Ribbon interface, which replaced the previous menu and toolbar structure, was the most noticeable update to Excel 2007. The addition of Themes and Cell Styles, which let users apply uniform formatting and visual styles across their whole workbook, was one of the most notable improvements. Excel 2007 included the Quick retrieve Toolbar, which allowed users to quickly customize and retrieve frequently used commands. Sparklines were a major addition to Excel 2007, which significantly improved data visualization. With the release of new chart kinds, such as the interactive and aesthetically appealing PivotChart, Excel 2007 enhanced its charting capabilities. The Formula AutoComplete feature was added to Excel in 2007 to facilitate formula creation and entry. Excel 2007's conditional formatting features for Data Bars and Colour Scales let users graphically highlight data points according to their values. Excel 2007's enhanced Sort and Filter features made data organisations and analysis easier. Excel 2007 had the Office Fluent user interface in addition to the Ribbon. This included a new Office button that took the place of the conventional File menu. Excel 2010 (14.0)
This version of Excel, which was released in the middle of 2010, strengthened its reputation as a flexible and essential tool for professionals in a variety of industries. The ongoing improvement of the Ribbon interface, which was first introduced in Excel 2007, was one of Excel 2010's most notable innovations. The Backstage View feature was added to Excel 2010, which significantly improved workflow and document management. With the sophisticated Slicer tool for PivotTables added in Excel 2010, users can now filter and analyse data in a more interactive and visual manner. Improvements were made to the Sparklines feature, which debuted in Excel 2010 and now gives users further customization and flexibility. With the help of Power Pivot, users could work with bigger datasets and create more intricate data linkages in their Excel spreadsheets. Excel 2010's inclusion of the Excel Web App was a major advancement towards cloud-based document sharing and collaboration. Excel 2010 introduced the Data Slicers function in response to the demand for better data analysis. Excel 2010 saw the release of the Power Query add-in, which allowed users to connect, import, and modify data from a variety of external sources right within Excel. When pasting data, Excel 2010's improved Paste Special feature gave users more choices and control. Excel 2016
Microsoft Excel 2016 is one of the most powerful spreadsheet applications in the Microsoft Office suite. Excel 2016 retains the familiar ribbon interface from Excel 2007, providing users with easy access to a wide range of instructions and operations. Excel 2016 comes with Power Query, another powerful tool for data processing and integration. Excel 2016 supports the application-to-application communication protocol known as Dynamic Data Exchange. Excel 2016 enhances Pivot Charts, building upon the capabilities of PivotTables. Excel 2016 includes an accessibility checker that ensures worksheets are usable by individuals with disabilities. The Exponential Smoothing forecasting approach is a more sophisticated tool that users may now utilize to predict patterns in time-series data thanks to Excel 2016. The Exponential Smoothing forecasting approach is a more sophisticated tool that users may now utilize to predict patterns in time-series data thanks to Excel 2016. It is therefore a feature-rich, flexible spreadsheet application that continues to evolve and offers users a broad range of data analysis options. Microsoft has made great strides in increasing accessibility with Excel 2016. The software includes features like a screen reader and narrator. In Excel 2016, Microsoft emphasizes cloud integration through OneDrive and SharePoint. It introduces users to 3D Maps, a technology that allows them to create dynamic 3D depictions of spatial and temporal data. Additional statistical tools have also been added to this edition to facilitate more complex data processing. Excel 2019
Building on the popularity of its predecessors, Excel 2019 provides a wide range of features and tools for data analysis, calculation, and visualization. One of the most notable aspects of Excel 2019 is the enhanced data analysis tools. Users may now construct visually beautiful presentations with 2D maps and funnel charts. Upgrades to Power Query and Power Pivot are coming in Excel 2019. This tool promotes teamwork and increases productivity by allowing multiple users to work on the same spreadsheet at once. Data security and integrity are also given top priority in Excel 2019. One of Excel's primary benefits is its formula capabilities and strong function. Teams may collaborate on projects more easily because of the seamless communication and real-time updates made available by the Microsoft365 connection. Dynamic Arrays, a new feature in Excel 2019, significantly enhances the user experience when working with formulas and functions. Microsoft provides a plethora of training and support resources for Excel 2019 users. Power View, another component of the Microsoft Power BI package, is included with Excel 2019. Excel's capacity to produce dynamic and visually appealing data presentations is improved by this interface. One of Excel's primary benefits is its formula capabilities and strong function. Teams can collaborate on projects more easily because of the seamless communication and real-time updates enabled by the Microsoft 365 connection. Excel 2019 has incorporated several sophisticated features to better meet the needs of power users and specialists. Excel 365
Dynamic arrays, a feature included in Excel 365, allow formulas to spill over into adjacent cells automatically. Real-time co-authoring is one of Excel 365's most crucial collaborative features. Users can define rules using the powerful data validation features in Excel 365. Through the manipulation of diverse input parameters, users can produce and compare multiple scenarios, providing a comprehensive comprehension of potential outcomes. Programming in Visual Basic for Applications (VBA) and macros is supported in Excel 365. The conditional formatting function in Excel 365 allows users to highlight and format cells based on predetermined criteria. Excel 365 comes with two built-in tools to enhance data visualization: Power Map and Power View. A browser-based version of the programme called Excel for the Web expands the program's user base. Smart Lookup is one tool that allows users to perform online research within the Excel interface. With Excel 365, formulas can now automatically spill over into adjacent cells and dynamic arrays. Real-time co-authoring is one of Excel 365's most crucial collaborative features. Users can convert raw data into rich entities using Excel 365's integrated data types. Excel 365 users can quickly upload their Excel data to Power BI, Microsoft's business analytics program. The integrated Power Pivot and Power Query features in Excel 365 enhance data analysis capabilities. Additionally, Excel 365 provides a variety of budget templates so users can rapidly create documents that look professional. ConclusionMicrosoft Excel has been an interesting journey over the years, one that has been characterized by constant innovation and adaptation to the shifting needs of users. In 1985, Microsoft released the first version of Excel as a component of the Office suite for the Apple Macintosh. It established the groundwork for the eventual dominant force in spreadsheet software. Examining Excel's many incarnations, from the first to the most recent, reveals a constant process of innovation, adaptability to new developments in technology, and a dedication to satisfying the changing needs of users.
Next TopicISBLANK Function in Microsoft Excel
|
 For Videos Join Our Youtube Channel: Join Now
Feedback
- Send your Feedback to [email protected]
Help Others, Please Share


