| |

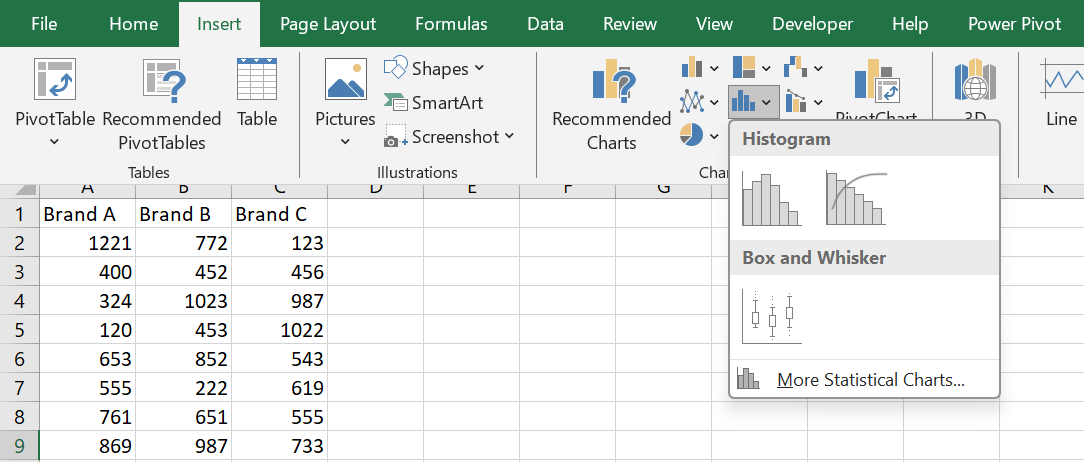
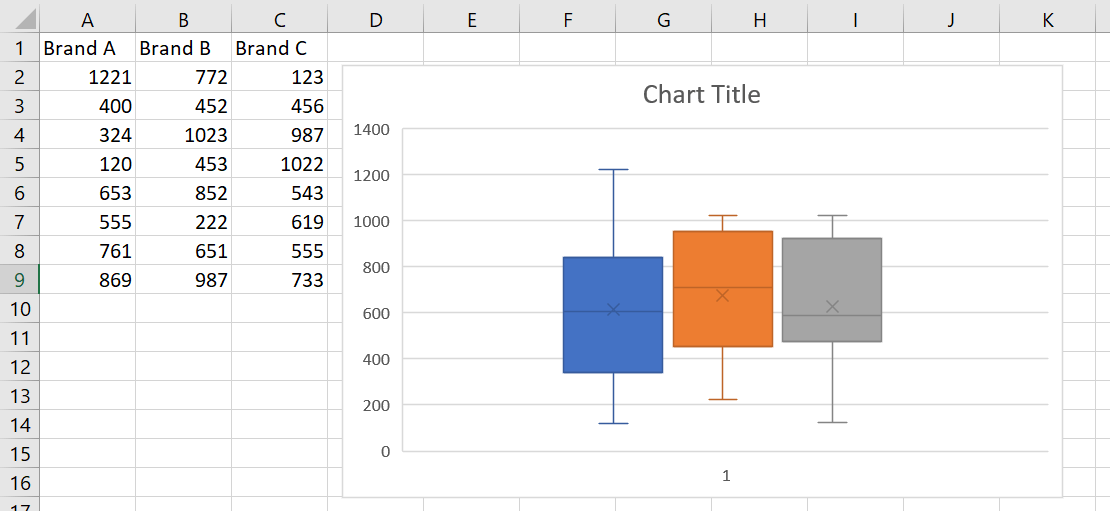
Outliers ExcelOutliers in Excel are facts points that substantially go away from a dataset's basic trend. Robust facts evaluation requires the detection of outliers since they are able to affect the precision and dependability of the findings. Excel gives numerous tools for locating and inspecting anomalies. Box-and-Whisker plots display feasible outliers and provide a visual snapshot of the records distribution. The descriptive statistics device provides important metrics like mean, median, or popular deviation, which helps with the first evaluation of records styles. Based on the same old deviation of their distances, Z-scores may be used to become aware of outliers by using quantifying a data point's divergence from the mean. Furthermore, Conditional Formatting is a feature that in Excel applies formatting standards to cells that satisfy predetermined criteria, making it viable to visually perceive possible outliers. Because of its flexibility, Excel is a beneficial tool for identifying outliers in various datasets and evaluation scenarios. What are Outliers, and Why are they Important?Extreme records factors that don't in shape properly with the remainder of the facts in a collection are called outliers. Errors within the dimension system, statistics entry, modifications to the experimental setup, or random version within the observed phenomenon can all contribute to them. Outliers can skew statistical measures of underlying patterns and variability, leading to inaccurate inferences from the data. Hence, it's far critical to understand and manipulate them. A box plot, which shows the distribution pattern beyond the data and emphasizes any values outside the whiskers, is a popular technique for locating outliers. Once outliers are located, they can be dealt with in several ways, including deleting them from the collection, altering the data, or applying strong statistical techniques less susceptible to outliers. However, any outlier handling technique should be carefully considered in light of how it will affect the overall evaluation and understanding of the data. Identifying Outliers with Box Plots in Excel:An information set's valuable tendency, variability, and any outliers are all supposed to be displayed graphically with the use of field plots.
Using Descriptive Statistics to Identify Outliers:The summary records for an information series can be computed using many descriptive statistics functions in Excel, including common, fashionable deviation, variance, and an interquartile range (IQR). Compared to the same old deviation, the IQR is a frequently used degree of version that is much less susceptible to outliers. Use Excel's '=QUARTILE.INC(Data, three) - QUARTILE.INC(Data, 1)' function to determine the IQR. A facts point is deemed an outlier if it is outside the range of Q1 - 1.5IQR to Q3 + 1.5IQR. 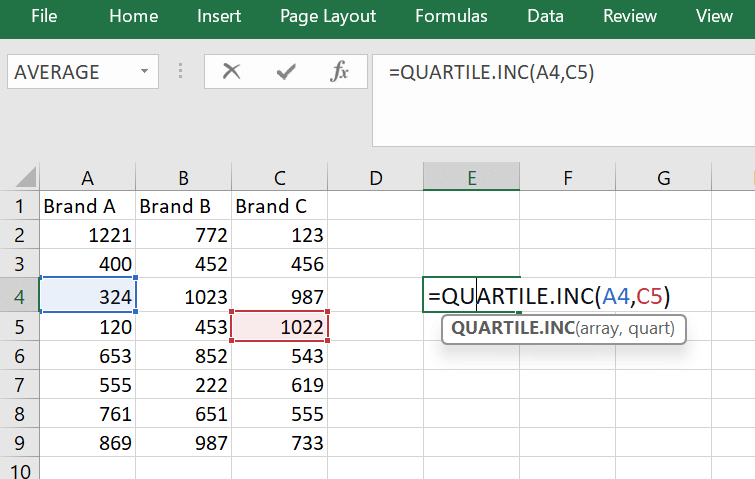
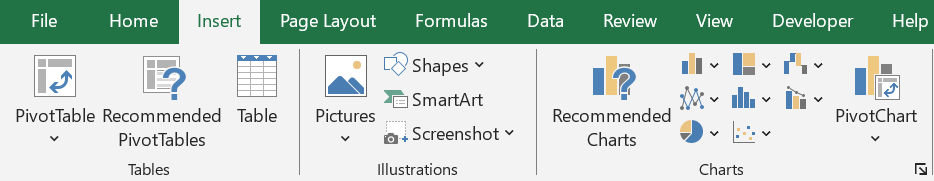
Finding outliers in a facts series is important because they have a massive impact on the results of statistical evaluation. Measuring errors, statistics entry issues, or severe numbers can all bring about outliers. It is possible to increase the precision and dependability of statistical analysis by locating and eliminating outliers. Several techniques exist for locating outliers, such as statistical testing and visual examination of data sets. On the other hand, identifying outliers in a data set is easy and effective when you use descriptive statistics like the IQR. It is advised to employ various techniques to find outliers and carefully evaluate the study's context and goal before determining whether or not to eliminate them. Discovering Outliers with Scatter Plots in Excel:Plotting the connection between variables is executed with scatter plots. Visually inspecting the plot and looking for points of facts that might be distant from the number one cluster of facts may be utilized to perceive outliers. In addition, scatter plots can assist you in seeing patterns or tendencies inside the records collection that different plot styles could pass over. In Excel, pick out facts and click on the 'Insert' choice to generate a scatter plot. To build a scatter plot, click the 'Scatter' graph and choose the desired kind. After that, prepare the chart as needed. 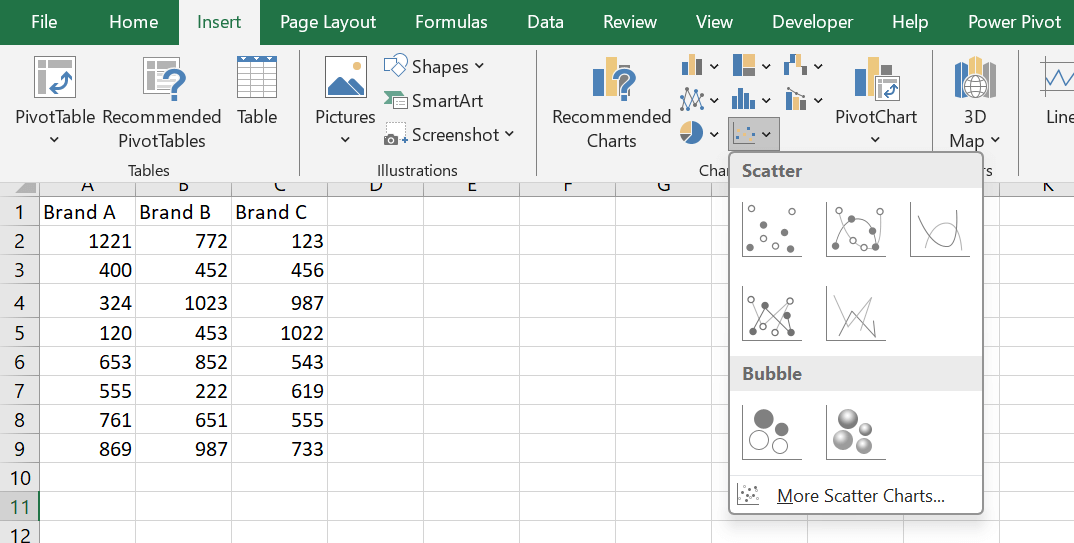
It is crucial to consider that outliers can extensively affect how statistical analyses flip out. As a result, an essential section in information processing is locating and managing outliers. Scatter plots prove to be a useful device in this process because they make it simple to identify any data points that might be distorting your findings. You can make sure that the information you acquire is extra unique and trustworthy by removing or accounting for outliers. 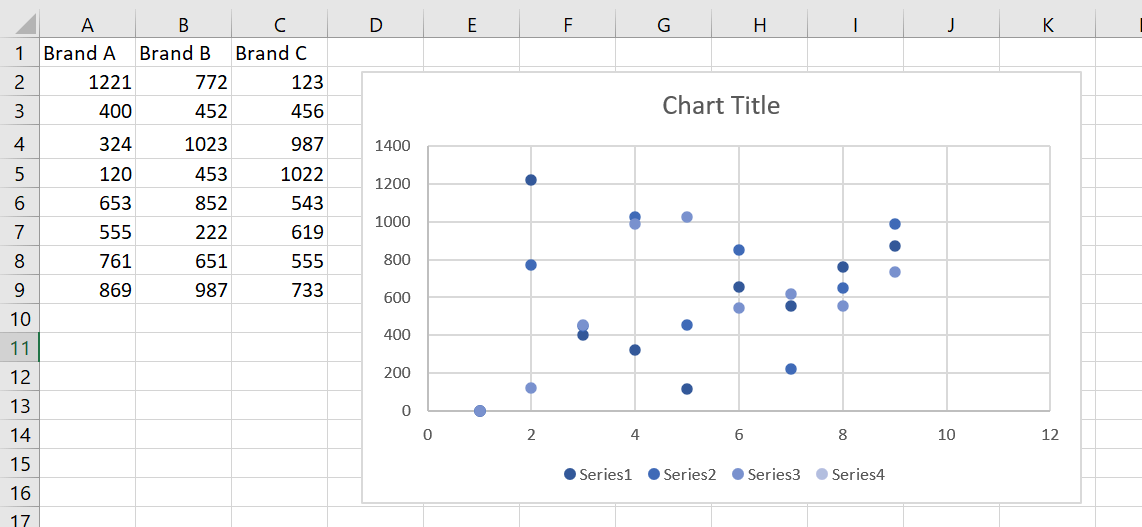
Understanding Z-Scores and their Role in Identifying Outliers:Z-scores express the number of preferred deviations while a cost deviates from the information set mean. By computing the z-rating for each data factor in the set of records and then contrasting it to a positive threshold, they can be used to locate outliers. 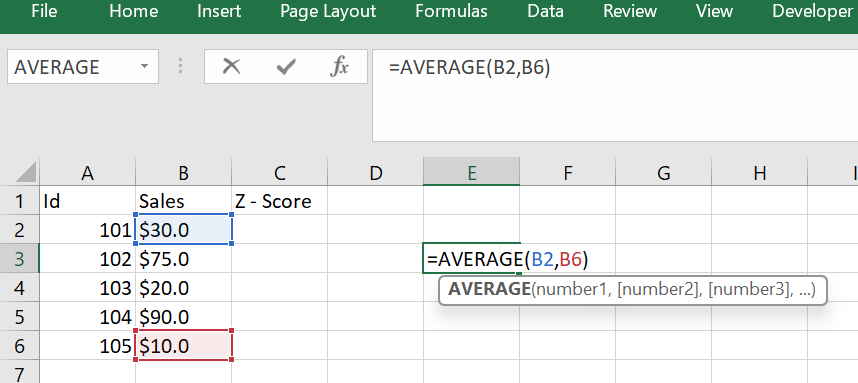
A facts factor is seen as an outlier if its z-score is more than three or less than 3. Use the equation '= (Data Point - Mean) / Standard Deviation' in Excel to decide the z-rating for a given facts factor. 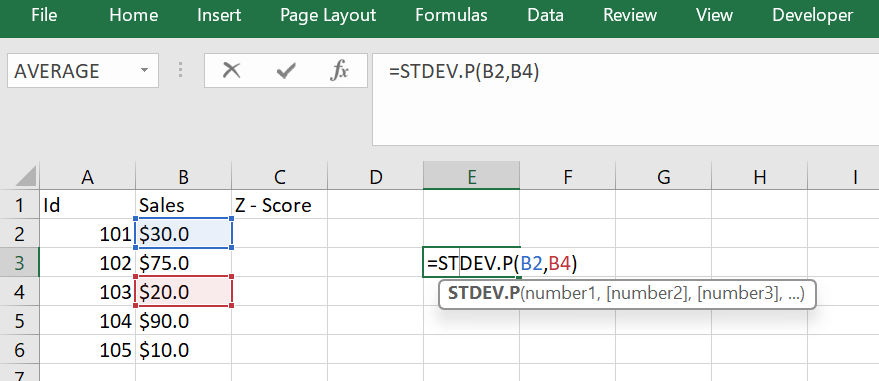
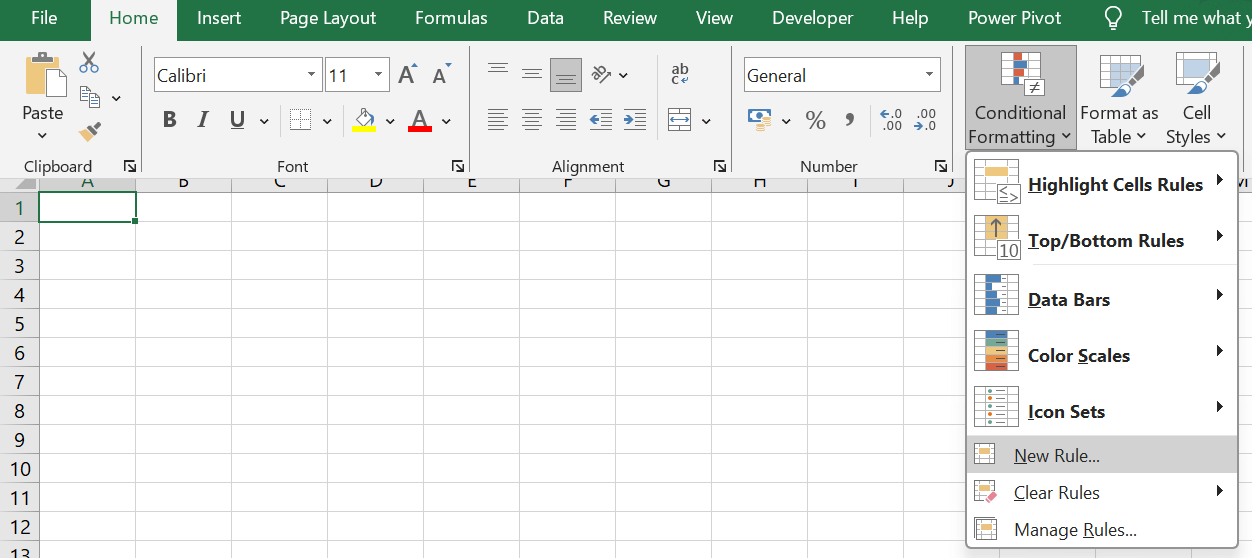
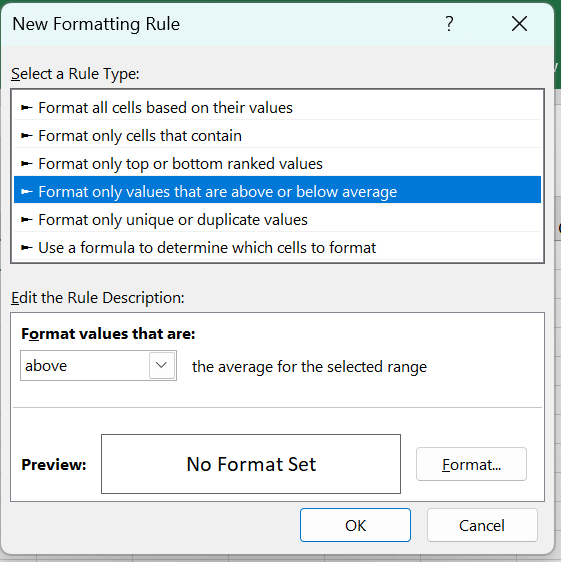
It's essential to recall that, despite the fact that they are probably beneficial in locating outliers, z-ratings shouldn't be the most effective approach. Other components, including the facts's context and the precise targets of the studies, must also be considered when figuring out outliers. Furthermore, before using z-ratings to detect outliers, ensure the statistics set has an ordinary distribution. How to Use Conditional Formatting to Highlight Outliers in Excel:Excel's powerful conditional formatting tool lets you format cells according to predefined standards. Establishing rules that format cells that satisfy specific requirements, such as ones higher than or less than a given number, can draw attention to outliers in a data set. To draw attention to outliers in your data using conditional formatting:
Choosing 'Format only cells that contain' is another approach to utilize conditional formatting to draw attention to outliers. This enables you to create conditions depending on text or specific values in the cells. For instance, cells containing values more than two standard deviations from the mean can be highlighted. This might assist you in rapidly locating any data values that deviate considerably from the whole data set. Conclusion:Finally, various equipment is to be had in Excel for locating and handling outliers in datasets. Excel gives customers the vital gear to discover and evaluate outliers, consisting of statistical metrics like Z-Scores, conditional formatting flexibility, and container-and-whisker plots. By utilizing utilizationibutes, analysts can augment the precision and dependability of their statistics evaluation, ensuring a greater all-encompassing comprehension of the fundamental patterns and attainable irregularities found in their datasets. |
 For Videos Join Our Youtube Channel: Join Now
Feedback
- Send your Feedback to [email protected]
Help Others, Please Share


