| |

Vlookup with the Countif Function in Microsoft ExcelIn Microsoft Excel, the respective VLOOKUP function is mainly considered as the powerful tool which can used for the purpose of searching and also use for retrieving out the information from a given table and also from the range of the data. Inspite of this, it allows users to specify a lookup value, search for it in the very first column of the selected table, and then soon it will be returning out the corresponding value from a specified column. More often this particular function is mainly used in the various scenarios, right from the simple data retrieval tasks to the more complex analysis of the data and its reporting. And in contrast to this, the respective COUNTIF function is primarily termed to be the handy Excel feature that enables the particular users to effectively count out the number of the cells within a given range which will meets out the specific criteria; despite all this, it will be also helpful in the evaluation of each of the cells in the given range that are against the specified condition and will increments the count for each cell and satisfies out the condition in an effective manner. And when it combined together, with the VLOOKUP function it becomes a potent tool for the effective analysis of the data. Here we will be discussing its working: First of all, the respective VLOOKUP function is primarily used for the purpose of locating a value in the first column of a table or the range. Once the value is found, and then the function will return a corresponding value from a specified column. This allows users to retrieve relevant information based on a lookup value quickly. Next, the COUNTIF function is applied for the purpose of counting the occurrences of the retrieved value within a given range of the data. By just specifying the range as well as the value to the count, users can now accurately determine the frequency of the occurrence of a particular value in their dataset as well. Moreover, the combination of the VLOOKUP with the COUNTIF function is particularly useful in the various scenarios as well.
The respective VLOOKUP with the COUNTIF function in Microsoft Excel usually provides users with a powerful tool for the purpose of searching, retrieving, as well as analyzing the data, thus making it a valuable asset for anyone who is working with spreadsheets and datasets effectively. What is meant by the Vlookup Function in Microsoft Excel?In Microsoft Excel, the "VLOOKUP" Excel function is primarily used for the purpose of searching out the particular value and is also responsible for the purpose of returning a corresponding match, which is based upon a unique identifier respectively. A unique identifier is uniquely associated with all the records of the database. For instance, employee ID, student roll number, customer contact number, seller email address, etc., are unique identifiers as well.
And just after applying the above formula, it will return the output as "1002." In simple words, a particular user may use the "VLOOKUP" formula in order to search specific information (such as employee ID) in an Excel database (table in Excel worksheet) and find information which is associated with the salary of the employee's salary with it. And more often, the "V" in VLOOKUP usually stands for the vertical. This function mainly looks for a search value in the very first column (lookup column) of the specified range and is also responsible for the purpose of returning a match from the same row of the other column (return column). The syntax for the Vlookup function in Microsoft ExcelThe syntax of the VLOOKUP Function that can be efficiently used by an individual in an Excel sheet is as follows: 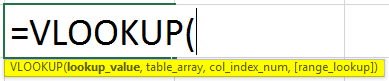
Here, in this particular syntax, the function usually accepts four basic arguments that are none other than the following ones: Moreover, in the above syntax the very first three arguments are considered as the mandatory one, while the last one is termed to be an optional one as well. So now let us deep dive into these arguments to get more factual information respectively:
What is meant by the term Countif Function in Microsoft Excel?The respective COUNTIF function in Microsoft Excel is a powerful tool that can be used for the purpose of counting out the number of cells within a specified range that usually meets a given condition or criteria. Its primary purpose is just to provide a quick as well as efficient way to tally out the data, which are based upon some of the specific parameters, thus enabling the users to analyze as well as to manipulate the large sets of information with ease.
The syntax for the COUNTIF function in Microsoft Excel The syntax of the COUNTIF function is quite straightforward: it mainly consists of two main components: the range as well as the criteria. The "range" refers to the group of cells that we actually want to evaluate, while the "criteria" establishes the condition that must be met for a cell to be included in the count as well. And this condition is very much capable taking out the various forms, that will include the following ones numerical values, logical expressions, etc. 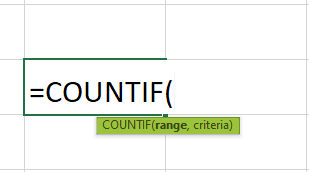
More often, if in case we have a range of the cells which are containing some of the numerical data and here in this we wish to determine how many of those cells contain values which are greater than the value 20, then it would make use of the COUNTIF function as follows: `=COUNTIF(range, ">20")`. Despite of all this, the versatility of the COUNTIF functions primarily makes it an invaluable tools for a wide range of applications, such as financial analysis, statistical reporting, inventory management. And by just providing a simple yet effective means of summarizing data based upon the user-defined criteria, the COUNTIF function mainly empowers the respective users to extract meaningful insights and helps an individual to make informed decisions. How can one make use of the Vlookup function with the Countif Function in Microsoft Excel?Here in this tutorial, we will be exploring how one easily combines the respective VLOOKUP function with the COUNTIF functions in Microsoft Excel, which are among the most widely used as well as influential tools in the software. It was well known that the "VLOOKUP "serves as a search engine within the Excel sheet, thus allowing users to pinpoint the specific data within a selected table by just referencing a key value. Contrary to this, the respective "COUNTIF" operates as a counter, tallying out the occurrences of the elements within a given range that are mostly based upon the predefined conditions as well. However, when these two functions are integrated, then they will form a potent analytical toolkit. By leveraging the VLOOKUP for the purpose of identifying the desired data points which are meeting the particular criteria and then applying the COUNTIF function to those results, users can efficiently search for and effectively quantify data within their datasets. This combined approach mainly enables the users to not only locate the specific information but also to assess its prevalence as well as the significance within the given dataset. In practical terms, this particular combination offers diverse applications. For instance, the respective users can now employ it to count the number of sales transactions that are above a certain threshold and more often track the frequency of the particular products in the records of the inventory or analyze customer feedback by category. By demonstrating the various strategies for the purpose of utilizing the "VLOOKUP" in conjunction with the COUNTIF, this tutorial aims to equip Microsoft Excel users with the skills that are needed to harness the full potential of these functions effectively. In spite of this, through real-world examples and step-by-step guidance, the particular readers will be now learning how to leverage this powerful combination in order to streamline the data analysis tasks, extracting valuable insights and thus make more informed decisions within the Excel sheet respectively. Making use of the Vlookup with the Countif Function: 3 Different WaysHere in this section, we will be now exploring three different practical ways for the purpose of leveraging the combination of the VLOOKUP function with the COUNTIF function in Microsoft Excel. First of all, we will be making use of this tandem function to efficiently determine how many times a specific event mainly occurs within a given set of data. This can be handy for tracking out the occurrences of particular actions, sales figures, or any other measurable event. Secondly, we will be now delving into the calculation of the average percentage from a designated range of the percentages efficiently. By just employing the VLOOKUP with the COUNTIF function, we can now swiftly compute the average of these percentages, which aid in performance analysis, grade calculation, or any scenario where averaging percentages is quite necessary. Lastly, we will be demonstrating how we can easily utilize the VLOOKUP function with the COUNTIF function in order to confirm the presence or absence of a certain value within a given dataset. And more often this method mostly offers a straightforward approach to validating the integrity of the data or checking for the existence of the specific entries in the list. By just mastering these particular techniques, the respective users can now enhance their data analysis capabilities as well as streamline the various tasks within the Excel sheet, thus saving time as well as improving the efficiency of the performed task. 1. Counting the Occurrences by making use of the VLOOKUP and COUNTIF functions in Microsoft Excel Here in this respective example we will be now making use of the Microsoft Excel's VLOOKUP function with the combination of the COUNTIF functions for the purpose of efficiently counting out the occurrences of the specific value in the selected dataset, respectively. In this example, we are mainly looking for managing the attendance records of the students, and despite of this we are also required to determine out how many times a particular student has attended class over the several weeks respectively. 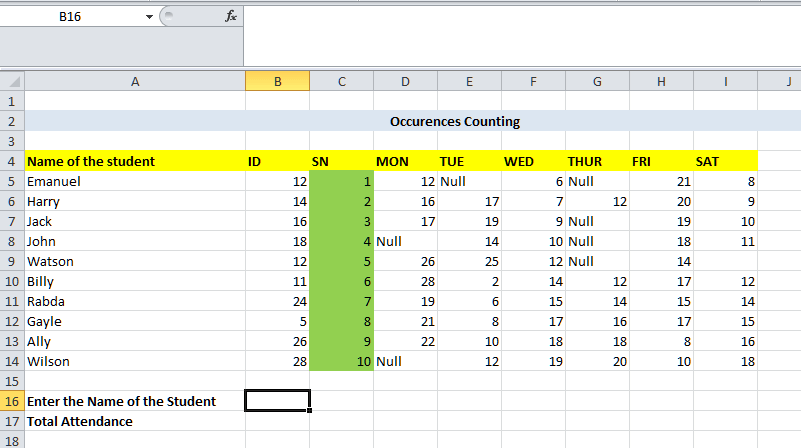
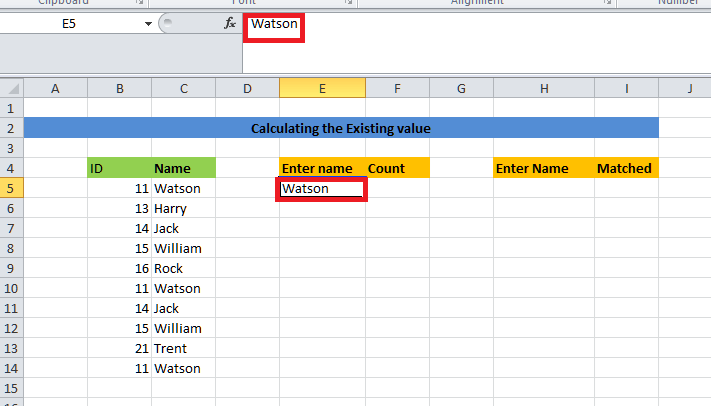
And in order to effectively achieve this task, we will be following the below-mentioned steps one by one respectively. 1. Required to make selection of the cell for entering the name of the student:
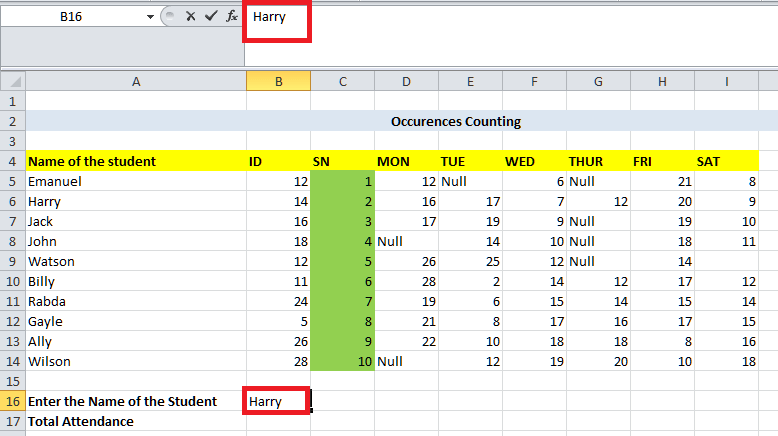
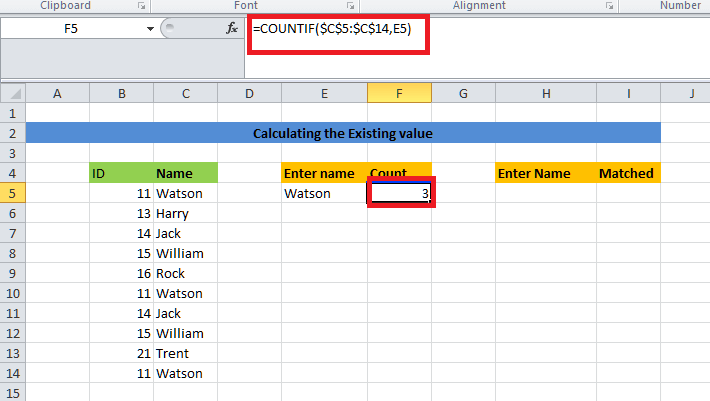
2. Enter the formula in the specific cell:
As this particular formula will then combine the VLOOKUP function and COUNTIF functions to effectively count the occurrences of the student's attendance. 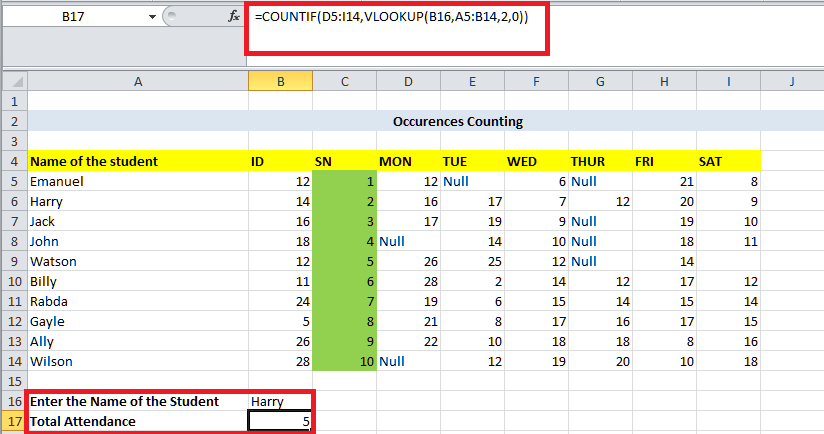
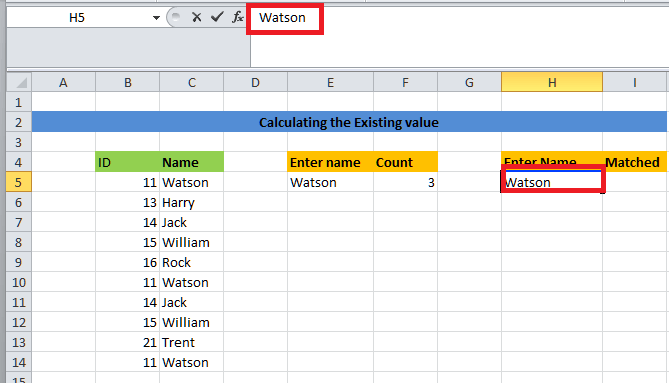
3. Understanding of the used Formula:
4. Result Interpretation:
5. Getting insight:
However, the respective used formula mainly allows us to count the occurrences of a specific value in the dynamic manner. And here, in this case, we would now consider out the number of the attendances that are usually based upon a lookup value student's name within our dataset. It is termed to be the powerful technique which can used for the purpose of analyzing and summarizing of the huge number of the datasets, especially when we are required to extract out the specific information based upon certain criteria. By just combining out the VLOOKUP function as well as the COUNTIF functions, we can now efficiently perform these particular calculations without manually sorting through our data as well. 2. Calculation of the Percentage by just making use of the Vlookup and Countif Function in Microsoft Excel It was well known that, in the realm of data analysis, precision as well as efficiency are key elements driving informed decision-making processes. Microsoft Excel functions such as the VLOOKUP function and COUNTIF function mainly serve as indispensable tools for the purpose of extracting insights from the selected datasets. In this context, let us delve into a specific application of these functions: by just computing out the average percentages for the students across the multiple courses, contingent upon meeting a predetermined criterion as well. So, for this, let us consider a scenario where we are actually tasked with the purpose of analyzing student performance across the various courses. Here, our main goal is to determine the average percentage that each of the students has achieved, provided they have marks for at least four courses as well. This analysis is crucial for the purpose of evaluating the student's progress and identifying the areas for improvement in an effective manner. 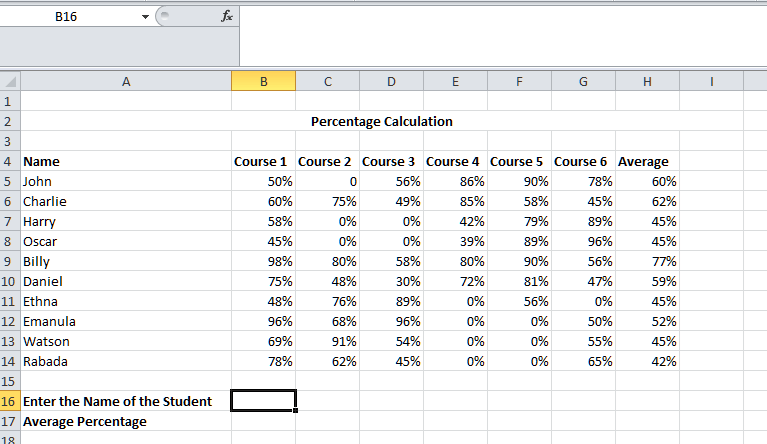
For the purpose of achieving the above objective task, we are required to follow the below-mentioned steps. 1. Data Input Selection:
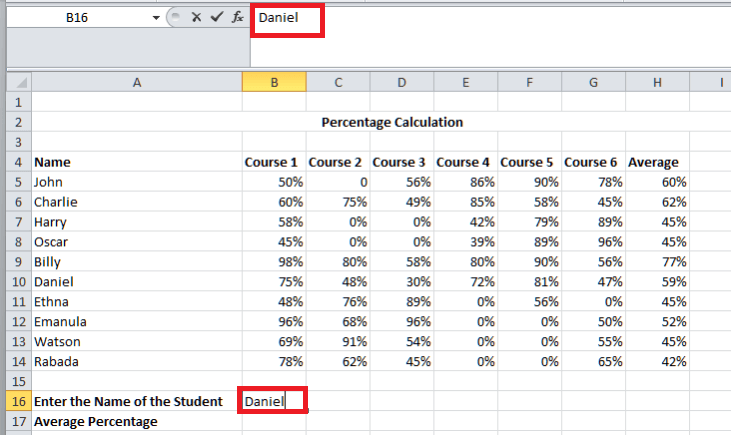
2. Effective Implementation of the Formula:
This particular formula will then combine the power of the COUNTIF function and the VLOOKUP functions for the purpose of calculating the average percentage for the particular student. 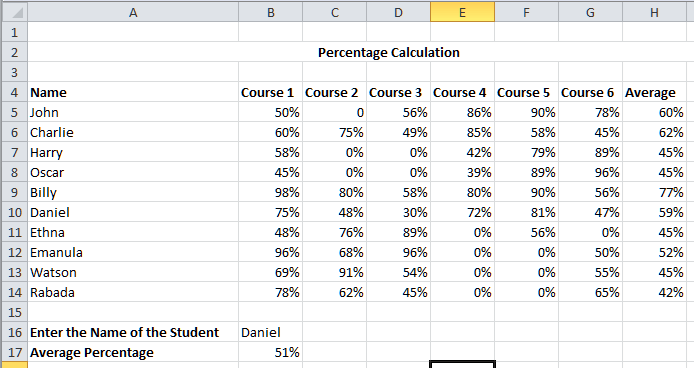
3. Interpretation of the Result:
4. Formula Breakdown
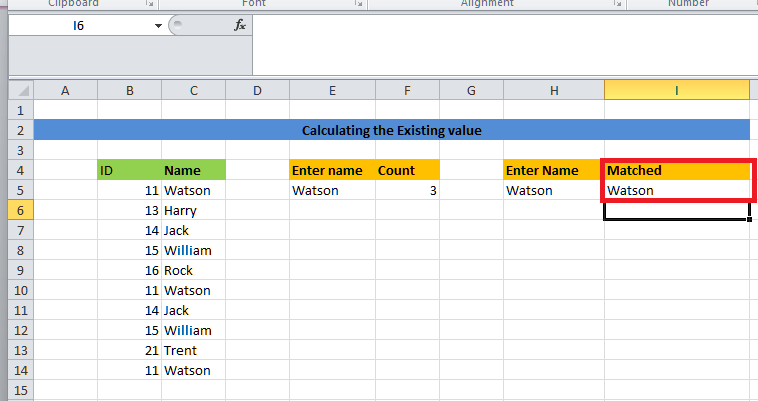
By seamlessly integrating the two important functions, which are none other than the VLOOKUP and COUNTIF functions, analysts can efficiently compute the average percentages, thereby gaining valuable insights into the performance of the particular student as well. This analytical approach enables educators as well as administrators to make data-driven decisions, identify areas for various interventions, and ultimately enhance educational outcomes. The versatility of these functions empowers users to navigate complex datasets with ease, fostering a deeper understanding of the student's progress and also achievement. In essence, mastering all these Excel functions usually unlocks a wealth of possibilities for the effective analysis of the data and decision-making in educational contexts. 3. VLOOKUP vs COUNTIF for determining if a value exists Now, here in this example, we will tryfind out how COUNTIF and VLOOKUP functions mainly handle the searching operations. To be specific, we will see if the total count of any element is zero, then what will be returned by the COUNTIF function and by the VLOOKUP functions as well. So here, let us assume that we have a dataset of the employees who are working in the company "Walmart" and their data has been stored with their names and IDs. There are repeated values in the table. Now, we will count the names and try to match them. 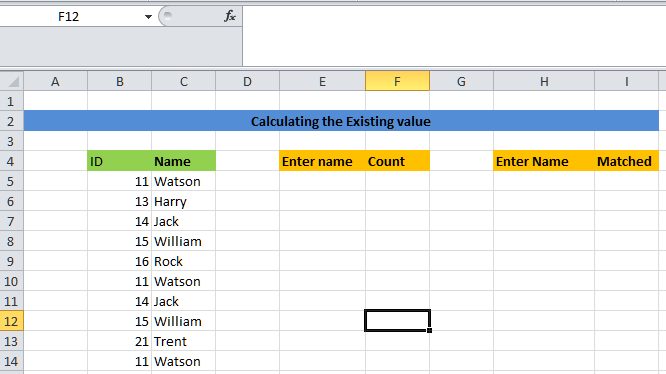
The steps which can be used for the purpose of achieving this task are as follows:
List out the various advantages of using Vlookup with the Countif Function in Microsoft Excel.It was well known that combining the `VLOOKUP` with the `COUNTIF` function in Microsoft Excel usually offers a potent toolkit for the purpose of performing various data analyses as well as manipulation tasks, thus providing numerous advantages across the different scenarios, which are as follows.
Moreover, it could be concluded that the combination of the `VLOOKUP` with the `COUNTIF` function primarily offers a versatile and the powerful toolkit for the efficient validation of the data, analysis of the range dynamically, conditional counting, effective handling of the error, complex manipulation of the data in the Microsoft Excel. Whether we are validating data, analyzing trends, or we are making out decisions that are based upon the various insights, and this dynamic duo usually empowers us to extract the maximum value from our selected datasets easily without facing any sort of the difficulties.
Next TopicWhat is Data Filtering
|
 For Videos Join Our Youtube Channel: Join Now
Feedback
- Send your Feedback to [email protected]
Help Others, Please Share


