| |

Do Engineers use Excel?Excel spreadsheet software applications are widely used in many organizations and millions of people worldwide. Based on the data requirement, the usage of Excel is increasing day by day. The popularity of Excel has increased due to its wide variety of features such as formulas, functions, charts and graphs, built-in features, pivot tables, Macro coding, etc. As it is used in various industries, there is a question of whether Engineers use Excel. Excel is inevitable in every field due to its features and functions. In this tutorial, the multiple uses of Excel in Engineering are explained. Applications of Excel in EngineeringExcel's functionality and adaptability make it a popular tool in engineering for various uses. The uses of Excel in Engineering are listed as follows: 1. Converting Numbers to Desired UnitsIn engineering, one frequent task is converting the number to the required units. Sometimes, converting isn't easy so the user can choose outside tools for conversion. To make it simple and to retrieve the result quickly, the CONVERT function is used in Excel. The syntax of the CONVERT function is: The arguments are explained as follows: Number- The number that needs to be converted from_unit- The existing unit, in which the number is present to_unit- The to team represents the number to be corrected. Excel consists of all base units in the Excel version (not all versions), which helps the user convert them to the desired units. Example: Convert the given number to the "mmHg" unit. In this example, the requirement is to convert the "psi" unit number to the "mmHg" number. The example to convert the number to the desired format is as follows: Enter the required number in cell A1, which is in psi format called pressure. In cell B1, enter the formula as =CONVERT (A1, "psi", "mmHg"). Press Enter. The result will be displayed in cell A1 in the format of "mmHg". 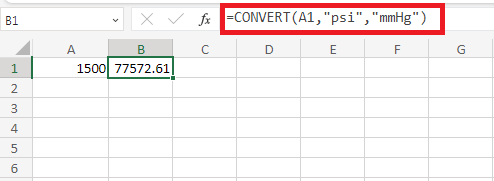
Example: Convert the given number to a "Pa" unit. In this example, the requirement is to convert the "psi" unit number to a "Pa" number called Pascal. The example to convert the number to the desired format is as follows: Enter the required number in cell A1, which is in psi format called pressure. In cell, B1, enter the formula as =CONVERT (A1, "psi", "Pa"). Press Enter. The result will be displayed in cell A1, in the format of "Pa", called Pascal. 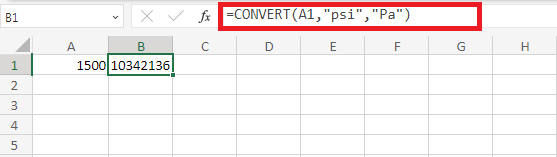
2. Creating a Named RangeCreating a Named Range for engineering purposes is an easy one. Engineering contains enormous formulas and functions that are used to calculate data. Creating a Named Range helps to eliminate the difficulty of entering the variable in a formula or equation in the data. The named range is designed for the variables used in the recipe. By using a named range, the new or third-party user can easily understand the variables present in the data. The user can create the named range by clicking the cell containing the variable and entering the range's name in the window's upper left corner. 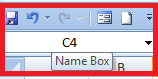
Another method to create the multiple Named Range for the variables is to select the cell range containing variables and click the option Formula>Define Name in the Defined Names. 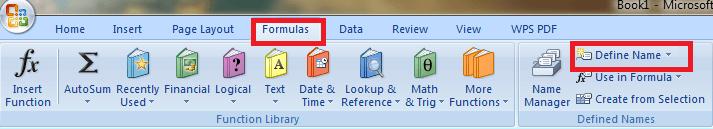
The New Name Dialog box will display, in which you enter the name of the named range. 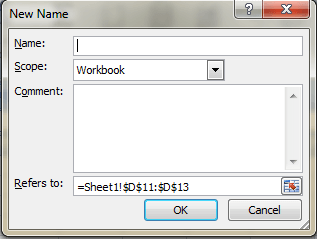
Click OK, and the named range for the selected data range will be created. 3. Charts with Automatic featuresComplex engineering data can be visually represented with Excel charts, which facilitates the interpretation of correlations, trends, and patterns in the data collection. Various charts are present in Excel, which Engineers can use based on the data requirement. It contains automatic features which are used to update the chart title easily. While creating a chart, the chart title, axis title and label need to be made. The titles are updated when it is linked directly in the cell. This feature is helpful while creating multiple charts in Excel, as it avoids errors when the user forgets to update the title in the chart. The steps to update the title of the chart using cell reference are as follows: Select the cell in which the chart title is to be entered. The text for the chart title will be entered in this cell. For example, the chart title is entered in cell A1. Type the =symbol in the formula and click cell A1 containing the chart title. Hence, in the formula bar, it is typed as =A1. Press Enter. The chart title will update the data. If the user wants to change the chart title, changes should be made in cell A1, where the chart title is present. 4. Goal Seek feature in Excel.As the name indicates, the Goal Seek feature achieves the goal by modifying or changing the input values. It is used in Engineering where the user can reach the target by knowing the exact input or formula. It is applicable in various fields such as,
The Goal Seek option in Excel is accessed by clicking the Data tab in the Ribbon tab. Choose the "What if Analysis" option in the Data Tools group. 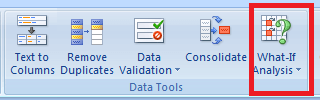
There are three options: choose Goal Seek. 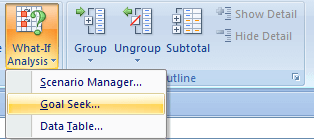
The Goal Seek dialog box will display. In that, it contains several options, 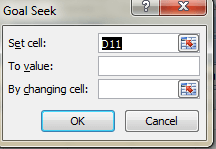
The cell containing the formula you wish to modify is called the "set cell."
By changing cell: This is the cell whose value Excel should change to accomplish the desired result. Now click OK after entering the information in the required field. The Goal Seek function adjusts the input based on the given value. Goal Seek is valid when the user wants to find the input value required to reach a particular target that you have in mind. It's a valuable tool for exploring various scenarios in your Excel models and conducting what-if analysis. 5. Excel functions for Calculating Data.Some functions such as HLOOKUP, VLOOKUP, INDEX, and MATCH are used to handle equations and tables of data present in Excel. Excel HLOOKUP (horizontal lookup) and VLOOKUP (vertical lookup) functions are widely used in engineering to search through tables and retrieve data. These functions come in especially handy when working with sizable datasets or engineering data tables. The INDEX and MATCH functions in Excel are widely used in engineering for various reasons, mainly when working with large datasets or tables of engineering data. 6. Excel formulas in EngineeringMicrosoft Excel is one of the powerful tools widely used on a large scale for official and personal use. By default, Excel consists of various formulas and functions, which help to calculate the data effectively and quickly. It saves the user's time and has high computational power and efficiency. MS Excel is used in various fields, such as Education. Hospitals, Government and private organizations, etc. It is also used to create Budgets, Balance Sheets, business decisions, calculate sales reports, etc. Some of the applications of Excel are as follows:
It is widely used software that can handle all types of data. Data like spreadsheets, images, and documents. In more straightforward terms, it is defined as a single roof for all work done easier. 7. Charts in EngineeringThe chart is defined as the graphical representation of data in various forms, such as Pie charts, bar charts, line charts, etc., based on the data and type of preference. It represents the data in an attractive and organized manner, which helps the user to arrive at conclusions easily and quickly. Why is data represented in the form of a chart? The data is represented in the form of a chart for the following reasons:
Types of Charts in Excel The various types of charts present in Excel are described as follows:
The chart displays the data based on the user's choice and data. 8. Pivot tableA pivot table in Excel summarises a large data set based on the requirement. It helps the user understand the extensive data set quickly with the help of an interactive summary retrieved from the source data. The pivot table sorts and filters the subsets of data, calculating the total and average, and cross tabulations are calculated. Advantages of using Pivot tableSeveral advantages of using Pivot Table are as follows:
SummaryThe various uses of Excel in Engineering are described in this tutorial. Excel consists of enormous functions and features; it is used in every field based on the data requirement. From the tutorial, it is known that Excel is a powerful and widely used tool.
Next TopicHow do you convert Notepad to Excel?
|
 For Videos Join Our Youtube Channel: Join Now
Feedback
- Send your Feedback to [email protected]
Help Others, Please Share


