| |

How to get Unique Count in Pivot TableIt was well known that the respective "Pivot tables" in Microsoft Excel basically serve as indispensable tools for the purpose of making effective analysis of the data, offering a swift as well as organized means of summarizing extensive datasets within spreadsheet software like Microsoft Excel or Google Sheets. One pivotal task within data analysis mainly involves determining the unique count of the items within a selected dataset-a process streamlined by the unique counts in the pivot tables, respectively. Now, before delving into the mechanics of achieving the unique counts in the pivot tables, it is considered the crucial part of the Excel sheet that, in turn used for the purpose of grasping the essence of the unique counts. More often, the respective "Unique counts" usually encapsulate the total number of the distinct values within a given dataset, thus providing insight into the diversity as well as the individuality present. For instance, within a list of customer names, the unique counts mainly elucidate the total number of distinct customers, disregarding the frequency of their appearances in an effective manner. However, in order to embark on the harnessing of the unique counts in the pivot tables, one must begin with a dataset brimming with the pertinent information awaiting analysis as well. Once armed with the requisite data, the journey begins by just crafting a pivot table. This will entail the selection of the entirety of the dataset as well as navigating to the designated tab-be it "Insert" or "Data," contingent on the employed spreadsheet software-where the option to erect a pivot table beckons. Upon the canvas of the newly forged pivot table, fields from the dataset are deftly positioned in order to orchestrate the desired analysis efficiently. These fields usually find homes within the rows, columns, values, or filters of the pivot table; each serves a distinct purpose. For the purpose of yielding the unique counts, attention gravitates towards appending the field housing the pertinent data to either the rows or the values section of the pivot table, respectively. More often for pursuing the unique counts within a selected pivot table unfolding through a meticulously choreographed sequence effectively:
Inspite of all this, with the respective unique counts dutifully that has been used within the pivot table; the stage is almost set for the effective discerning analysis. Armed with the insights garnered from the distinct values that are available within the given dataset, informed decisions await, empowering users in order to navigate the labyrinth of the data with confidence as well as clarity. In essence, the respective unique counts in pivot tables usually furnish an elegant and productive methodology for dissecting the individuality inherent within the given datasets, propelling users towards enlightenment as well as informed decision-making. What is meant by the term unique value in the Pivot Table?A unique value in the Pivot Table basically denotes a singular instance of the data point within a selected dataset, contrasting with the duplicate values that mainly occur multiple times. These unique occurrences provide insights into the diversity as well as the distinctiveness of the data effectively. Identifying the unique values within a given dataset is quite pivotal in the various data analysis tasks, thus facilitating comprehension as well as enabling specific calculations respectively. In practical terms, let us suppose that we have a list of customer IDs in a sales database. Each customer ID usually represents a unique customer. By identifying the unique values among these particular IDs, we can now ascertain the total number of distinct customers, disregarding how many times each customer appears in the list. This distinction aids in understanding customer behaviour, segmenting markets, and analyzing customer loyalty, among other applications. And more often in the similar manner, in the fields of the inventory management, identification of the unique product codes can easily help in determining the total variety of the products which are made available to the customer. In the statistical analysis, the respective unique value majorly plays an important role for the purpose of calculating out the frequencies, probabilities, and also the other metrics in an effective manner. However detecting of the unique values in a given dataset offenly involves techniques such as: sorting, filtering, and also making use of the functions that are specifically designed for this purpose as well. Once identified, the particular unique values primarily serve as the foundational elements for the further analysis, and thus enabling researchers, analysts, and also the decision-makers to derive out the meaningful insights and can effectively make use of the informed choices that are based upon the distinct characteristics that are available within the selected data. Let us assume that we have gone to one of the supermarkets 5 times to buy groceries in the last month. The owner of the supermarket usually wants to know how many customers came in the previous month. So, the question is now: They actually want to know how many customers have come, not how many times. So, we might have gone 8 times in our case as well, but the actual customer count is 1, not 5.
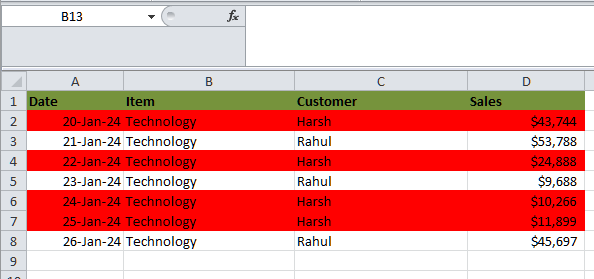
In the above data table, we mainly have two customers: "Harsh" and "Rahul," who usually go to the supermarket on different dates. Still, when we apply the pivot table to get the total customer count, we will get a result like the one mentioned below. 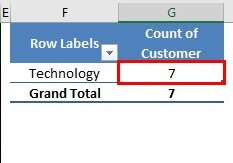
Upon applying the Pivot Table, we got a unique customer count of 7. In comparison, only two of the customers have come to the supermarket. So, getting a unique count is more complex. And it is all about the unique count, but with the help of the PivotTable, we need this luxury of getting unique values. So, we need to make use of the different strategies in order to get the unique count of the values respectively. How can one easily get Unique Value in the Pivot Table?In this part, we will be discussing out the Example that will help us to get a better understanding of the unique value in the Pivot table respectively: Example: Let us now suppose that we are actually running a business name "Kolkata Machinery Store" and have sold sewing machine to various countries in the past 12 months. Now, we actually want to check how many unique customers (in our example, let us consider the country as a customer) we have achieved during this period of time respectively. We have traded with multiple countries, and out of which, we only want to figure out the unique country values effectively. And more often, just a small example for our reference here. We are not making use of the entire year's data. Since it is a trade that has been recorded day-wise, it will be a huge one. Just for a realization, see the image which has been mentioned below: 
And if in case we go through the data, than we can say that three unique country values are none other than the following ones: India, USA, as well as the Germany. However, if we do a pivot table and count the Destination Country, then the results are somewhat weird, as it was clearly seen in the below-mentioned image respectively. 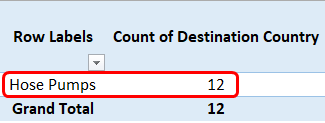
Now, on proceeding further, the count for countries we traded is 12 in the pivot table, which is not a unique count. So, for this particular situation, we are required to amend the pivot table for the purpose of getting the unique count. So, in this tutorial, we will make an individual walk through the method by which an individual can efficiently count the unique values in the Pivot Table, and one needs to follow the steps mentioned below effectively: Note: It must be noted that this particular technique of getting unique values in the pivot table only applies to Microsoft Excel 2013 or later versions.So, for this particular example, let us consider only the data depicted in the above screenshot, which is effectively spread across cell A1 to cell D13. Step 1: First of all, we are required to select the data range for this entire tabular data set, which mainly spreads across cells A1 to the cell D13. 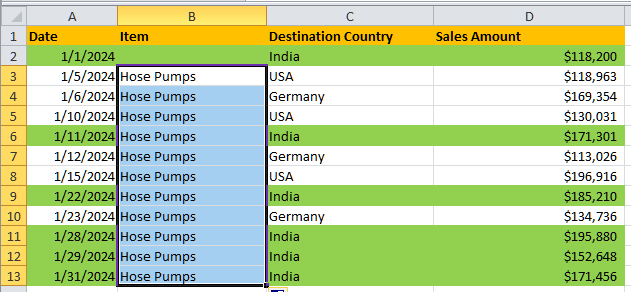
Step 2: In this particular step, we will be adding a pivot table for the selected range of data. And in order to do so, we must need to go to the Insert tab which has been placed on the upper ribbon in the Excel sheet. After that, we need to click on the Insert menu tab respectively. 
Step 3: Once we click on the Insert menu tab, we will encountered with the different insert options associated with the selected range of the cells; and out of those under the "Tables group", we can easily see PivotTable. Now, we will click on it to add a pivot table for a given range of data effectively. 
Despite all this, we also have a shortcut button that can be used to add a pivot table in Microsoft Excel sheet, and that is none other than the use of Alt + N + V as a keyboard shortcut to insert a pivot table. This will also allow us to add a pivot table in Microsoft Excel. Step 4: As soon as we click on the PivotTable option under the Tables group inside the Insert tab, a new window named "Create PivotTable" will pop up. As it was clearly depicted in the image mentioned below: 
Step 5: Within the Create PivotTable window that pops up, we can add the range of cells on which we are required to apply the pivot table. This can be easily done under the Select a Table or Range section. By default, our range of data is selected at the start of the creation itself. 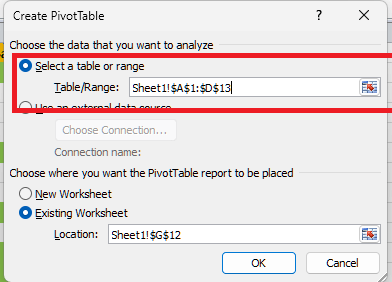
Step 6: The destination where the pivot table needs to be created has two choices. Either we can create it on a new worksheet or in an existing worksheet. Click on the radio button next to it. We will choose the Existing Worksheet option for this particular example. 
Step 7: Now in this step we will be giving the location cell where we actually want to store the pivot table in the existing worksheet. Here in this we will be making use of the location as cell H2 respectively. 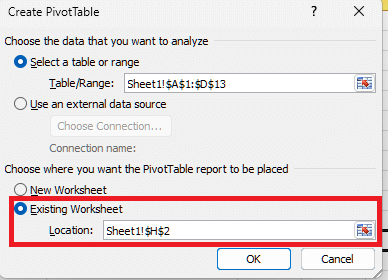
Step 8: At the bottom of the Create PivotTable window, we will be able to see a checkbox Add this data to the Data Model. And we need to tick to select this checkbox. And this will allow us to count the unique values in the pivot table. 
And just after that we are required to click on the OK button, and that's it. We will have a blank pivot table, as shown in the screenshot below: 
Step 9: Now, under the "Pivot Table Fields," we just need to select the Item made available under Rows and the Destination Country under the Values section below. We can do this by dragging and dropping fields with the mentioned name under the respective tabular section. 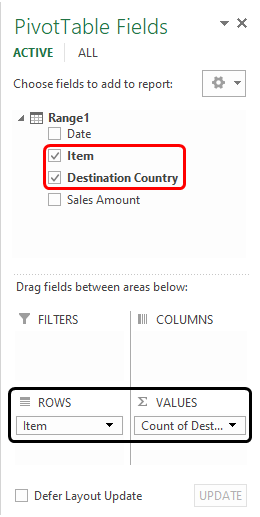
We are still waiting for a unique Destination Country count, as expected. In order to get the same, we need to follow the steps below: Step 10: We must right-click on the Count of the Destination Country Column, and we will see a list of options, as shown below. Then, we must select the Value Field Settings… option from those. 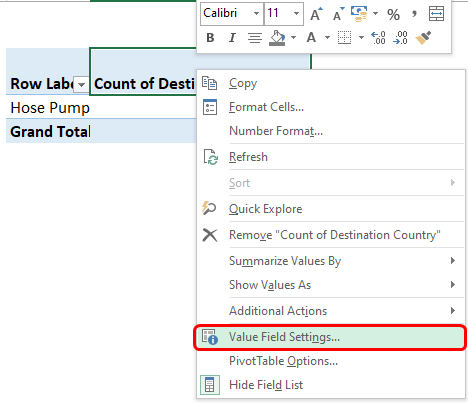
This will open the Value Field Settings window, as shown below. We can clearly see that the current summarization type is COUNT for value fields (e.g., the Destination Country column). Since the COUNT option only counts the number of rows present in source data, in our case, it is answering 12 because we have 12 rows in the given data for the Destination Country. 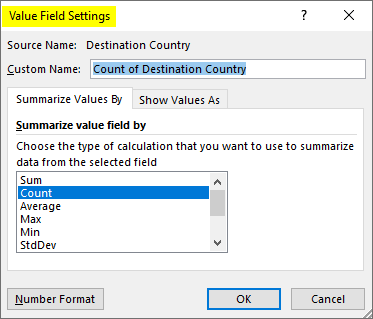
However, it should not be like this; we need unique, distinct values to be counted for the Destination Country column. We need to do something to achieve this. Navigate through the Summarization type using the scroll bar, and click on the Distinct Count option to count the unique values. Once we are done with this, we need to click on the OK button. 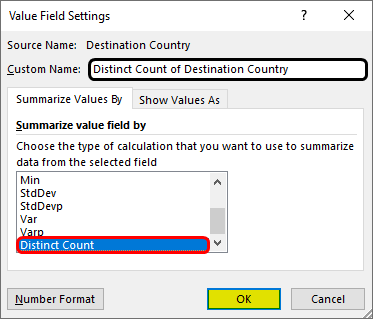
As soon as we select the Distinct Count and hit the OK button, we will be presented with the value for the count of the Destination Country column, as clearly depicted in the screenshot mentioned below. It specifies the unique count of values present under the Destination Country column. 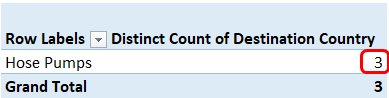
This is how we can get the count of unique values under PivotTable in Excel. List out the various advantages of making use of the Unique Count in Pivot Table?It was well known that the respective "Pivot tables" are mainly considered to be powerful tools that can be used for the purpose of making effective analysis of the data, thus enabling users to summarize as well as to analyze large datasets effectively. One of the key functionalities of the pivot tables is the ability to calculate the unique counts. Here in this section, we will be exploring the advantages of utilizing unique counts in the pivot tables for the analysis of the data and also highlighting how this approach will enhance the accuracy, insight generation, decision-making, data interpretation, as well as visualization. 1. Accurate Analysis:In traditional data analysis methods, counting occurrences of the respective data points might result in double-counting, especially when we are actually dealing with duplicates. Despite of all this, the respective "Unique count" functionality in the pivot tables helps us to overcomes this challenge by just accurately counting only and only the distinct values that are available under the given set of data, and this will ensures that each of the item is usually counted only once, thus providing a precise representation of the data. 2. It provides insight into Variability:Understanding the variability within a selected dataset is very much important for the purpose of identifying out the patterns, trends, as well as the anomalies. The "Unique count" in the pivot tables mainly offers insight into the diversity as well as the uniqueness of the data elements. And by presenting the number of the distinct values for a particular attribute, the respective analysts can now gain a deeper understanding of the dataset's variability in an efficient manner.
3. Effective Decision-making:It was well known that the informed decision-making mainly relies upon the reliability as well as on the accuracy of the data analysis, and the respective "Unique count pivot tables" majorly contribute to the better decision-making by just providing out the clear as well as the concise information about the uniqueness of the data elements. 4. Effective Interpretation of the Data:Interpreting of the complex datasets can be quite challenging, specifically when we are dealing with huge amount of the dataset. The respective "Unique count pivot tables" usually simplify the interpretation of the data by just presenting out the number of the available distinct values for each attribute, making it easier for the analysts to efficiently understand and to interpret the data. As this clarity will enhances the efficiency of the data analysis and will enables the analysts to derive out the actionable insights more effectively.
5. Improved Visualization:Visualization plays an important role in the analysis of the data, as it helps stakeholders to understand complex information quickly and intuitively. Unique count pivot tables can be visually appealing and easy to interpret as compared to other functions in Pivot Table, thus enhancing the data visualization capabilities. And by just presenting out the unique counts in a clear and in more structured format, the respective pivot tables enable stakeholders in order to grasp insights at a glance easily. ConclusionMore often it was well concluded that, leveraging out the unique count functionality in the pivot tables primarily offers a significant advantages for the effective analysis of the data that are made available in the Microsoft Excel. And by accurately counting only the distinct values within a given dataset, the unique count calculations usually eliminate out the concept of redundancy and will then provide a more precise representation of the data respectively. "Unique count pivot tables" enable analysts to gain deeper insights into the variability of the dataset, making effective identification to the patterns, trends, as well as anomalies associated with the data, and it will helps in making informed decisions that are based upon the reliable insights. While unique count calculations may require various specific methods, such as utilizing of the Data Model feature in older versions of the Microsoft Excel, the benefits they may offer can make them indispensable tools for the data analysis tasks. By understanding the nuances of the unique count calculations and incorporating them into the pivot table analyses, users can now effectively unlock the full potential of their data and can drive business success.
Next TopicXLS to PDF
|
 For Videos Join Our Youtube Channel: Join Now
Feedback
- Send your Feedback to [email protected]
Help Others, Please Share


