Table vs Range in Microsoft Excel
In Microsoft Excel, a table is termed to be a dynamic and organized arrangement of the data presented in the form of rows and columns. Tables provide a structured format that primarily facilitates the efficient management of the data and its analysis. One of the key advantages of using tables is their ability to expand to accommodate additional data automatically. This feature simplifies the process of including new information without the need for manual adjustments, thus enhancing the overall flexibility as well as the scalability of the data organization in an effective manner.
Moreover, the Tables in Microsoft Excel have been equipped with powerful tools, such as sorting and filtering options, making it easier for the different users to analyze and visualize the specific subsets of the data, as these functionalities contribute to a more streamlined and user-friendly approach to work with the huge amount of the datasets. Despite this, the tables allow the use of structured references in formulas, thus promoting clearer and more understandable expressions for the calculations.
Similarly, a range in Microsoft Excel primarily refers to the collection of the cells that are identified by the reference of the upper-left cell and also with the lower-right cell connected by a colon. In spite of this, Ranges serve as the foundation for performing the different Microsoft Excel operations, including calculations, data manipulation, and formatting. Whether used in basic functions or complex formulas, ranges play a fundamental role in specifying the location of the data within a spreadsheet, forming the building blocks for effective data processing and analysis.
What is a Table in Microsoft Excel?
In Microsoft Excel, a table is a structured arrangement of the data presented in the form of rows and columns. It acts as an organized framework within a spreadsheet, allowing users to manage efficiently and analyze information. The defining feature of the tables basically lies in their dynamic nature - they automatically adjust in size as data is added or removed. This automatic expansion makes tables highly adaptable, eliminating the need for manual adjustments and providing a seamless way to handle changing datasets as well.
Moreover, the respective tables in Microsoft Excel typically include column headers for the clear identification of the data in each column. They also offer practical tools like sorting and filtering, simplifying tasks related to data organization and analysis. In addition to this, tables support structured references in the formulas, where an individual can efficiently make use of the column names instead of making use of the traditional cell references, enhancing clarity and reducing the likelihood of errors in calculations.
Creation of the tables in Microsoft Excel
Important steps that we are required to follow before the creation of the tables in Microsoft Excel are as follows:
Step 1: First, we will proceed with the removal of all the blank rows and columns from the selected data.
Step 2: We need to assign a unique name to each column used in the datasheet.
How can one easily create Tables in Microsoft Excel?
It is quite effortless to create a Table in Microsoft Excel, so now let us understand the working of the tables with the help of some examples:
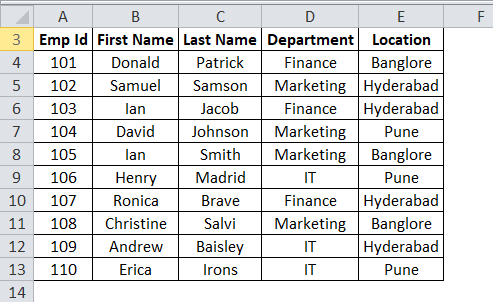
Step 1: First of all, let us take company employee data.
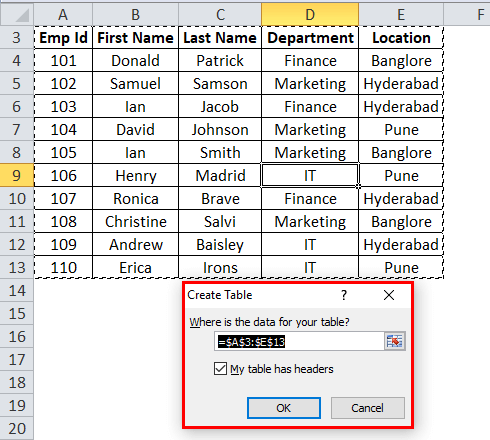
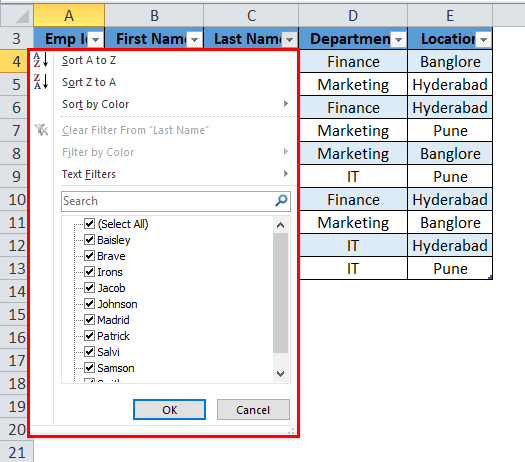
Step 2: Now, after, considering the employee data, we are required to check the data; that it should not contain any empty rows or empty columns. We are required to put our cursor anywhere in the selected data and will then press out the shortcut keys CTRL+T from our keyboard; by performing this, it will open a dialog box.
Step 2: Now, after, considering the employee data, we are required to check the data; that it should not contain any empty rows or empty columns. We are required to put our cursor anywhere in the selected data and will then press out the shortcut keys CTRL+T from our keyboard; by performing this, it will open a dialog box.
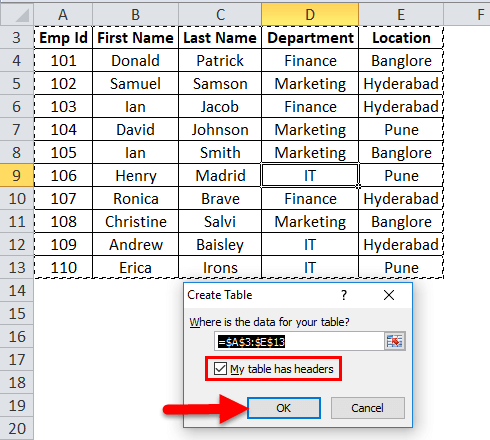
Step 3: After that, we will make sure that the checkbox My Table has headers ticked, as it will consider the first row as a header; after that, we will click on the OK option to proceed with the next step.
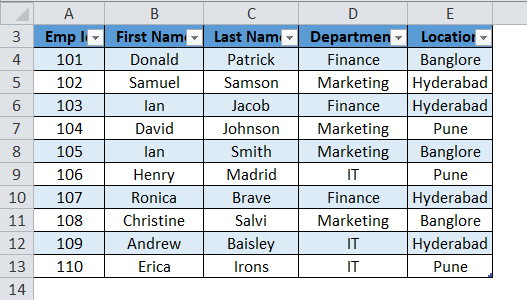
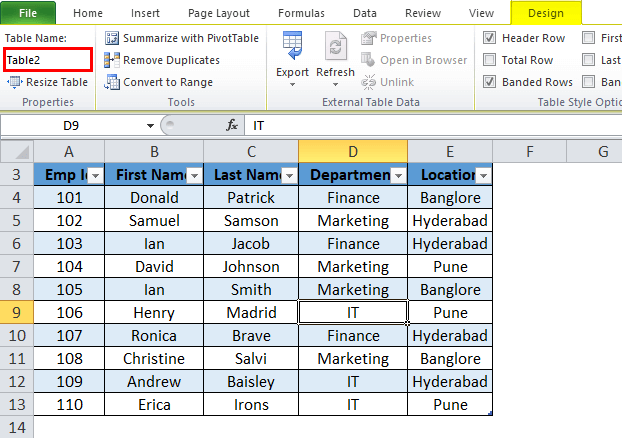
Step 4: Now, just after clicking on the OK button, it will be then creating a table like the screenshot below.
Step 5: After performing the above step, it will open a separate Table tools design window along with the Table, and with the help of this, we can also able to customize our tables very easily.
Steps used in Excel for customizing Tables
- Table Name
More often, the respective Microsoft Excel basically provides a default name, like if in case we have a table 1, then the Excel sheet will assign that respective Table as Table 1. As we can see in our example, Microsoft Excel gives the table name as Table 2 respectively.
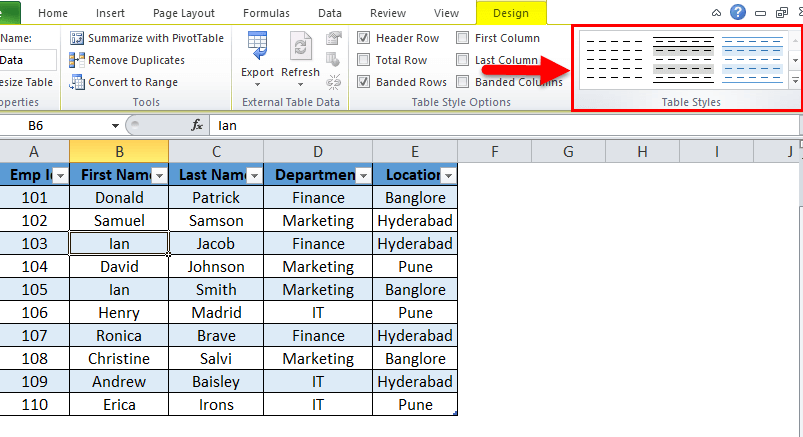
- Table Color
In the Excel sheet, we can also add the color to the selected Table, and this could be effectively achieved by just clicking on the Table Styles section, which can be seen under the Design tab. after doing this, we will choose the color accordingly. As depicted in the below-mentioned screenshot:
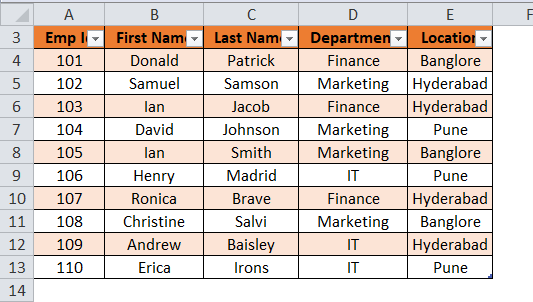
After proceeding with the steps mentioned above, we will get the output as follows below:
Benefits of using Excel Table
The various benefits of making use of Microsoft Tables are as follows:
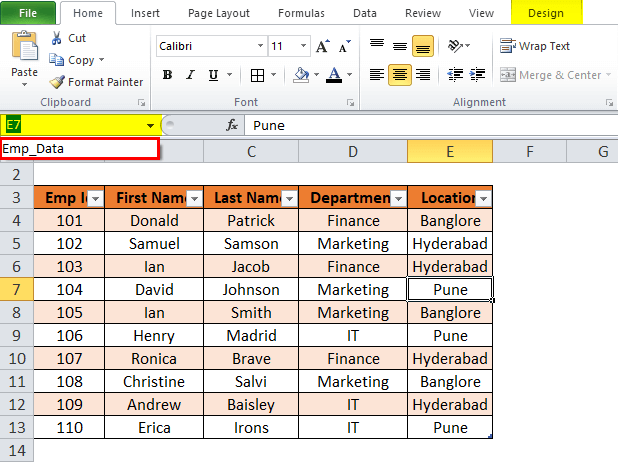
- We can efficiently navigate between the tables if in case, we have more than one Table in the Excel sheet. The Name Box drop-down usually depicts all names of the Table from which we can select the one on which we want to work.
- The Table will get expanded when we add more numbers of rows as well as columns.
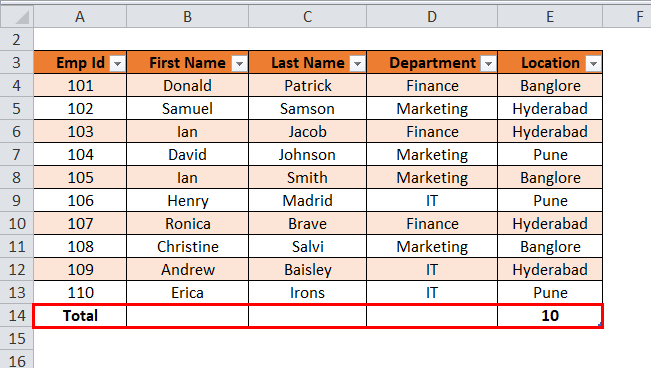
- The Total Row option can easily perform operations such as a sum of the data and counting of the data, respectively.
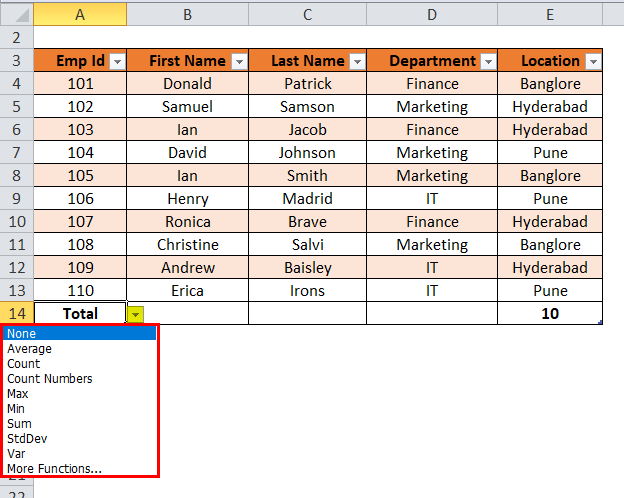
- For this facility, we are required to click anywhere in the Table and then press the shortcut key that is none other than CTRL+SHIFT+T from our respective keyboard, as seen in the below-mentioned screenshot below.
- Once we click on the Total option, it will show a drop-down list of the different mathematical operations.
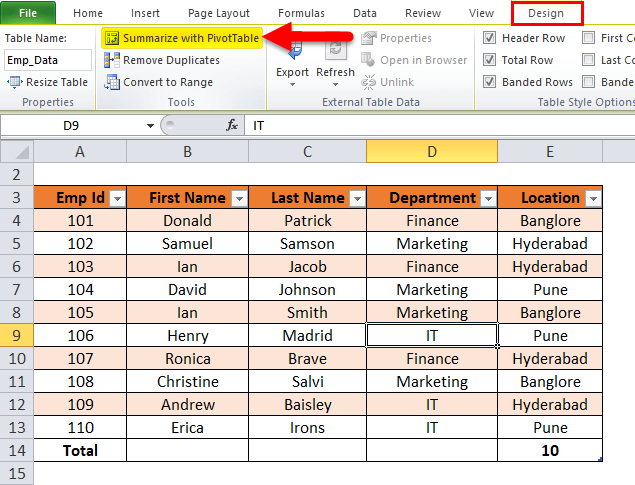
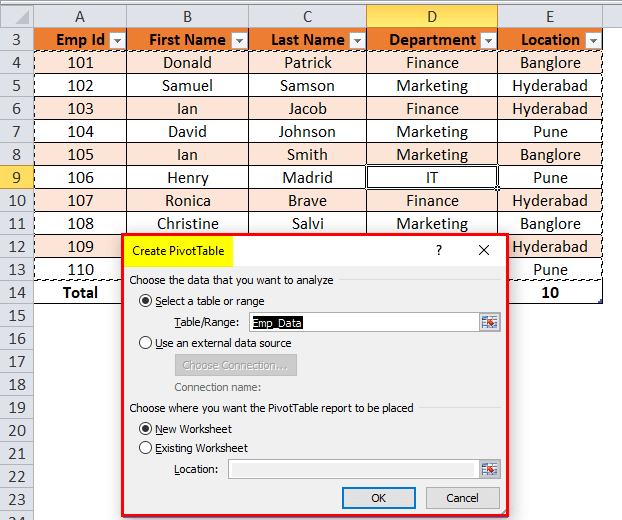
- With the help of the Excel table, we are able to Pivot Table. Then we will be clicking anywhere in the Table and will choose the Summarize with Pivot Table option, that are available under the Tools section.
- And just clicking on the above option, we will encounter a dialog box, that is, "Create Pivot Table."
List key characteristics of the Table in Microsoft Excel.
The Key characteristics of the Table in Microsoft Excel are as follows:
- Dynamic Range: Tables automatically adjust in size to accommodate changes in the dataset, thus providing a dynamic as well as adaptable structure.
- Column Headers: Tables typically have headers for each column, offering a clear as well as a descriptive way to label and identify data effectively.
- Automatic Expansion: As new data is added, tables expand seamlessly without the need for manual adjustments, simplifying data maintenance.
- Structured References: Tables support the use of structured references in formulas, allowing users to refer to the data by just making use of the column names rather than traditional cell references, enhancing clarity and reducing errors.
- Visual Formatting: Tables often have distinct formatting, making them visually distinguishable within the spreadsheet and aiding quick identification.
- Total Row: Tables can include a "Total Row" option, providing quick calculations like sum or average for the numerical data in the selected Table.
- Easy Data Entry: Tables facilitate efficient data entry, and when we are entering the data below or adjacent to a table, then in that case it will be automatically expanding to include the new information as well.
More often, all these characteristics collectively make tables in Microsoft Excel a powerful and user-friendly feature for the purpose of managing, analyzing, and visualizing the data effectively.
Advantages of using Table in Microsoft Excel
The Table has been built with various advantages, which are as follows:
- Organization: Tables in Microsoft Excel help us to keep our data organized and structured, thus making it easier to understand and navigate efficiently.
- Dynamic Range: As we add new data, tables automatically expand, ensuring our entire dataset is included without manual adjustments.
- Sorting and Filtering: More often, the respective tables provide quick sorting and filtering options, allowing us to arrange and view data in a way that suits our needs.
- Visual Appeal: Tables enhance the visual appeal of our respective spreadsheets, making them more professional and easier to read as well.
- Formulas and Functions: In Microsoft Excel, tables make it easy to use formulas and functions with the help of structured references, simplifying calculations and reducing errors effectively.
- Data Validation: We can easily apply data validation rules within a table, ensuring data accuracy and consistency.
- Easy References: Structured references in tables make it simpler to reference and work with the specific columns or rows in our formulas.
- Total Row: Tables automatically provide a total row, simplifying the calculation of sums or other functions for the columns of the data effectively.
Furthermore, making use of the tables in Microsoft Excel efficiently improves data management, analysis, as well as presentation, thus contributing to a more efficient and visually appealing spreadsheet.
What is Range in Microsoft Excel?
In Microsoft Excel, a "range" is like a selected group of cells that primarily forms a rectangular area on our respective spreadsheet. Think of it as highlighting a specific block of the particular cells to work with. When we mention a range, we will be talking about the starting cell present in the top-left corner and also the ending cell in the bottom-right corner, and it will be separated with the help of the comma. For the purpose of understanding the concept of the Range in more detailed form, let us break it down further. Imagine we have a bunch of cells with the information, and we actually want to focus on a particular section. We would be specifying the beginning cell and the ending cell to define our Range as well. For instance, if we say B1:C5, it means that we are including all the cells ranging from B1 to C5 in our respective selected Range.
More often, Ranges in Microsoft Excel are like the canvas where we can easily perform various tasks. We can do calculations, analyze data, or apply formatting specifically to the cells within that Range as well. It is a way to tell Excel, "Hey, we want to do something with this particular set of cells. "Whether we are summing up values, finding averages, or formatting a specific block of the data, using ranges makes our tasks more precise and targeted. So, the next time we are working on an Excel spreadsheet and we hear about ranges, think of it as our way of telling Excel which cells we basically want to include in a particular operation or an analysis.
List out the Important characteristics of the Range in Microsoft Excel.
The various key characteristics which are associated with the use of Range in Microsoft Excel are as follows:
- Cell Selection: A range is a selection of the particular cells on a spreadsheet. It could be defined by specifying the address of the top-left cell as well as the bottom-right cell, which is separated by a colon. For example, A1:B5.
- Rectangular Area: Ranges always form a rectangular area on the spreadsheet. The top-left and bottom-right cells primarily define the corners of this rectangle.
- Data Manipulation: Ranges are widely used for the purpose of performing various operations on the data, such as calculations, sorting, and filtering.
- Cell References: And with a range, cells are usually referenced relative to the top-left cell respectively. For instance, if C1:D5 is a range, C1 is the starting point, and D5 is the endpoint for calculations or operations.
- Named Ranges: Microsoft Excel usually allows users to assign names to the ranges, making it easier to reference and understand. This can enhance the readability of formulas and improve spreadsheet organization.
- Data Analysis: Ranges play an important role in performing tasks like data analysis using features like charts, pivot tables, and statistical functions. They enable users to focus on the specific subsets of the data.
- Conditional Formatting: Conditional formatting, which involves formatting cells based upon certain criteria, often operates within a specified range. This is useful for visually highlighting the specific data points.
- Dynamic Ranges: Moreover, Microsoft Excel also supports dynamic ranges that can automatically adjust their size, which are based upon the data they encompass. This is quite useful when we are working with data that may change in size with time.
Proper understanding and wise use of the ranges in Microsoft Excel are termed to be the fundamental aspects for managing and manipulating data efficiently within selected spreadsheets.
Advantages of suing Range in Microsoft Excel
Making use of the ranges in Microsoft Excel offers several advantages that streamline data management and analysis, providing users with a more efficient and organized experience. Here are some key benefits explained in the human language:
- Data Organization: Ranges help us to organize data in a structured manner within a spreadsheet. For example, Instead of scattering information across the various cells, we can group related data using ranges, making it easier to locate and manage as well.
- Efficient Formulas: Ranges simplify the use of the formulas, allowing us to perform calculations on a set of adjacent cells effortlessly. For example, let's consider a column of numbers in that particular scenario. We can make use of a range like B1:B10 in a formula to sum or average those values without manually specifying each cell.
- Quick Navigation: Ranges facilitate quick navigation to the specific areas of a spreadsheet. For example, By naming a range, we can instantly jump to a particular section of our sheet, enhancing overall user navigation and also reducing the time spent scrolling.
- Consistency in Formulas: Ranges ensure consistency when applying formulas to similar sets of data.For example, Suppose we use a range for a calculation in one part of our sheet. In that case, we can easily replicate the formula for another similar set of data by just adjusting the Range, maintaining accuracy and efficiency.
- Dynamic Data Range Expansion: Ranges allow for dynamic expansion as data grows, eliminating the need to update formulas manually.For example, Suppose in case we add more rows or columns to our respective dataset. In that case, a well-defined range adjusts automatically, ensuring that our formulas still cover the entire dataset without requiring manual adjustments effectively.
- Data Validation: Ranges are integral to the validation of the data, helping ensure data accuracy as well as consistency.For example, We can set up validation rules by just making use of the ranges, restricting data entry to a specific range of values or types, preventing errors, and enhancing data integrity as well.
- Named Ranges for Clarity: Named ranges provide a clear and meaningful label to a group of cells, enhancing spreadsheet readability.For example, Instead of referring to a range as C2:C30, we can name it "Sales Data" for better understanding, especially when sharing the spreadsheet with others.
- Conditional Formatting: Ranges are essential for applying conditional formatting in order to highlight the specific data patterns. For example, We can use a range to apply formatting rules, such as highlighting cells with values above a certain threshold, making it easier to identify trends or outliers.
- Chart Creation: Ranges simplify the process of creating charts, as they can be directly used as data sources.For example: Selecting a range for a chart allows us to efficiently visualize data trends as well as the patterns, aiding in data interpretation and presentation.
- Data Analysis with Functions: Ranges facilitate the use of the various functions for in-depth data analysis.For example, Functions like SUM (), AVERAGE (), and COUNT() are more powerful when applied to ranges, providing comprehensive insights into our data.
Moreover, leveraging ranges in Microsoft Excel enhances data organization, simplifies formula usage, supports efficient navigation, ensures consistency, accommodates dynamic data changes, aids in data validation, improves spreadsheet clarity, enables conditional formatting, simplifies chart creation, and facilitates in-depth data analysis. Integrating ranges into our Excel workflow enhances productivity and makes data management more accessible.
How can one easily Find Range in Microsoft Excel?
It was well known that, in Microsoft Excel, finding the range in Excel is quite an easy process, and it could be effectively created by just making use of the Excel in-built functions, which are none other than MAX and MIN. So, on deep diving into the concept of Range, first of all, we will understand the workings of finding a range in Microsoft Excel with the help of the following examples:
Example 1: Range in Microsoft Excel
In this example, we have selected a list of the values such as:24, 11, 48, 21, 3, 60, 5, 36, and in this list, the largest number is 60 while the smallest is 3. So with the help of this, we can easily calculate Range as: 60-3 = 57
Explanation:
- So, in the case of the above example, our Range is calculated to be 57, which usually defines the span of the above-selected dataset. More often, it will also give us a visual indication of the Range as we are looking for the highest as well as the smallest point.
- If, we are having our dataset as large, then it will be giving us the widespread of the result and vice versa for the smallest dataset.
- If the dataset is small, it gives us a closely centered result as well.
A process that can be used for defining the Range in Microsoft Excel: So, for the purpose of defining the Range, we are about to find out the maximum and the minimum values for the given dataset. In this process, we have two main functions that play an important role. They are:
- MAX
- MIN
Making use of the Max Function:
Example 2: Range in Microsoft Excel
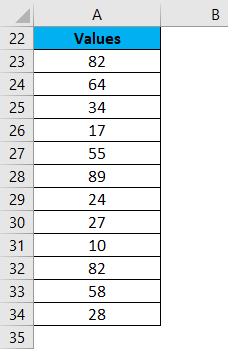
- To understand the Max Function, we have considered the below-mentioned values of the data.
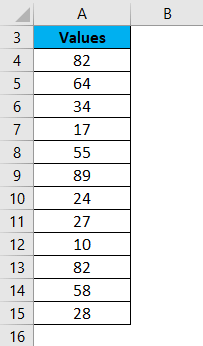
- To find out the maximum value for the above dataset, we will be making use of the Max function:
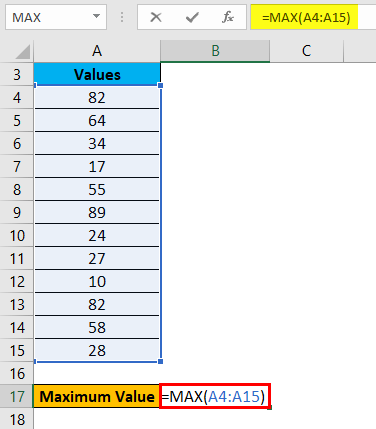
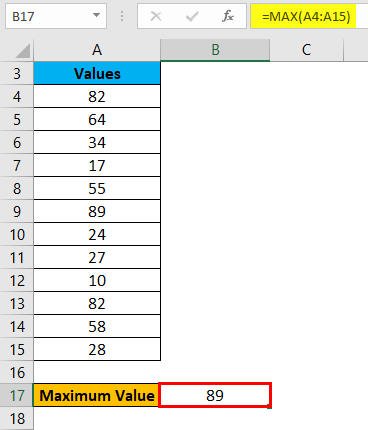
- After applying the max function, we will hit the enter button, as it will give us the maximum value.
Example 3: Range in Microsoft Excel
Making use of the MIN function in Microsoft Excel sheet:
- Now, let us take the same dataset for the purpose of understanding the usage of this function effectively.
- In order to calculate the minimum value from the given dataset, we will be making use of the MIN function.
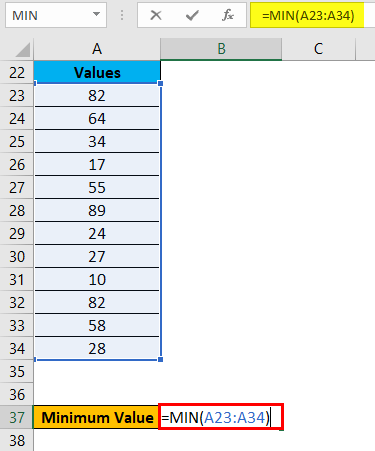
- Just after that, we will be pressing out the ENTER key, as it will give us the minimum value. The result is given below:
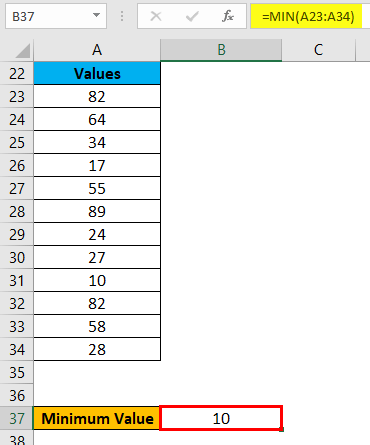
- With this, we can easily find out the Range of the dataset just after taking the difference between Maximum values as well as the Minimum values.
- We can also reduce the steps for the purpose of calculating the Range of a dataset by just making use of the MAX and MIN functions together in one line.
Example 4: Range in Microsoft Excel
- And now for this particular example, we will be assuming the below dataset of a company employee with their achieved sales target as well.
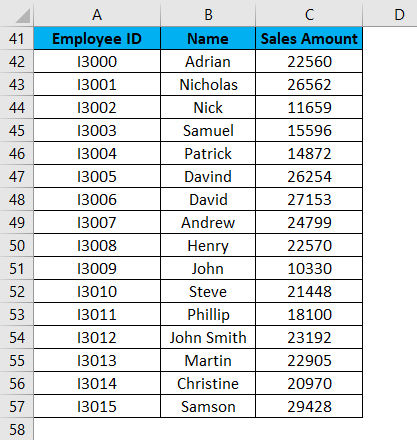
- So, for the purpose of identifying the span of the particular sales amount in the above dataset, we will be making use of the calculated Range.
- In this step, we will be making use of the MAX and MIN functions for the purpose of calculating the Maximum and Minimum sales amount in the given data. As seen in the below-mentioned screenshot:
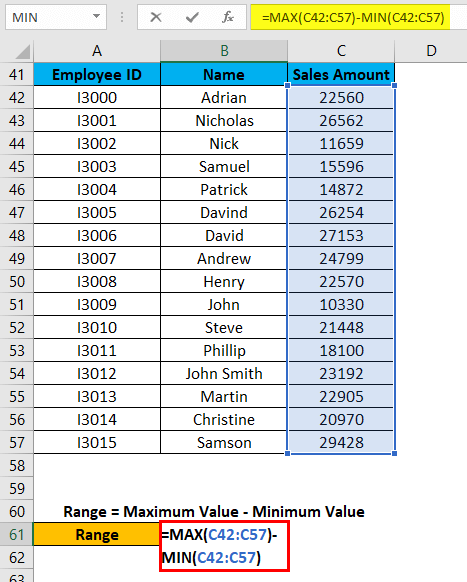
- Now, we are required to press the Enter key, and it will give us the Range of the dataset respectively.
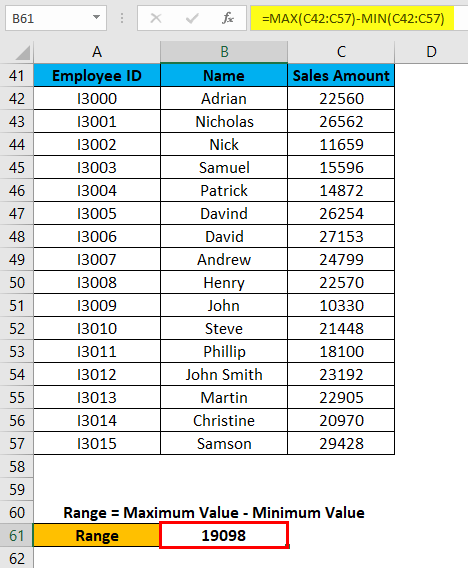
As we can see in the above screenshot, we have effectively applied the MAX as well as the MIN formulas in one line, and by just calculating their results difference, we are able to found out the Range of the dataset in an effective manner.
|

 For Videos Join Our Youtube Channel: Join Now


