| |

Project Management Dashboard ExcelThe dynamic and intricate project management process necessitates efficient planning, coordination, and communication. The requirement for a centralized tool to track, evaluate, and share essential project data increases with the size and complexity of projects. Presenting the Project Leadership Dashboard, a visual depiction of vital project information created to give stakeholders instantaneous access to report on the project's status. Definition of a Project Management Dashboard:A project management dashboard is an integrated, graphical representation of all the pertinent project data in one interface. By utilizing the capabilities of Excel from Microsoft, a popular spreadsheet program, project managers can design personalized dashboards suited to their projects' particular requirements. This application acts as a central point, providing stakeholders with an extensive overview of the state, advancement, and any obstacles to the project. Importance of Project Management Dashboard:A project management screen is important because it may simplify complex data into visually appealing representations that are simple to comprehend. This speeds up decision-making and improves communication between stakeholders and team members. With Excel, a well-known and flexible tool, project leaders can create robust dashboards that adjust to the unique needs of their projects. Key Benefits of a Project Management Dashboard in Excel:
Worksheets in this Project Management Dashboard:Dashboard:We have an eye-catching traffic light visualization of the project status on the dashboard sheet tab. The total task count on a card. Made three lovely doughnut charts to show Pending, In Progress, and Completed tasks. In summary, a doughnut graphic shows the risk splitting (Low, Medium, and High). The percentage of "Task not begun even after intended start date" and "Task in progress regardless after planned end date" is shown in the following card. To display the Top 10 Risks, we generated a dynamic table in the previous section. We have provided a drop-down menu with a yellow accent to help you choose the risk level. 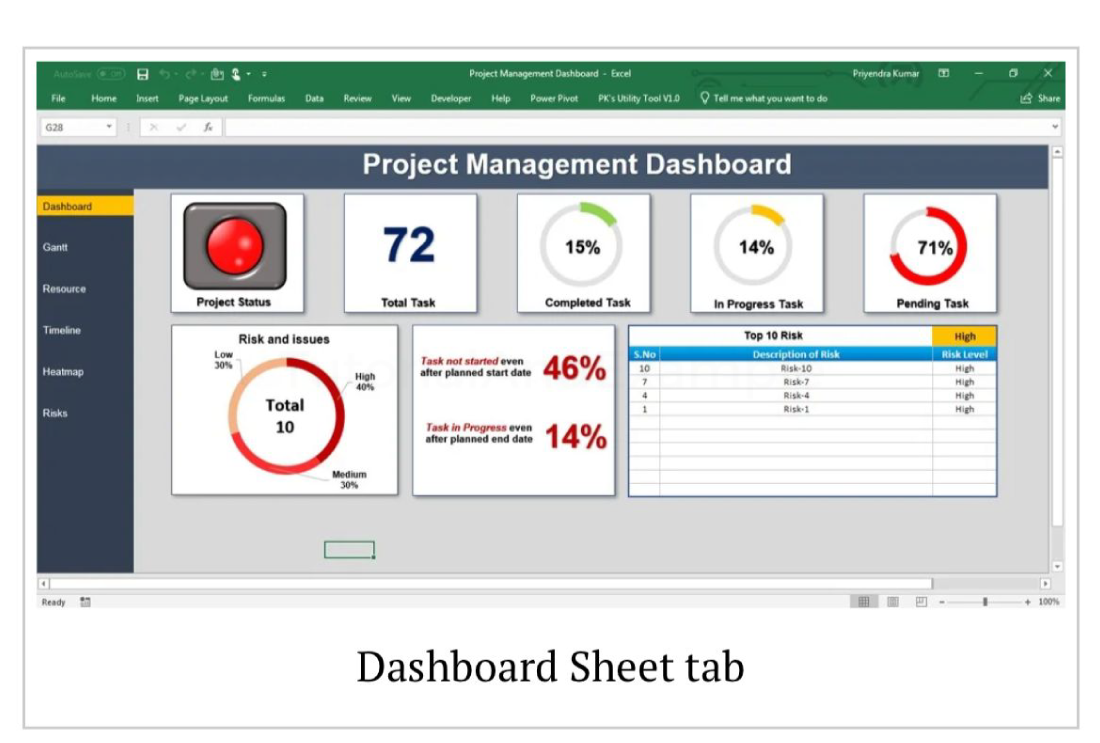
Gantt:We have used Formulas and Conditional Formatting to construct a dynamic Gantt chart in the Gantt Sheet tab. Here, we have made both horizontal and vertical scroll bars. Dates may be slid using the flat scroll bar, and tasks can be slid using the vertical scroll bar. We have the legends shown on top. Holidays and weekends have a dynamic relationship with the setting sheet. 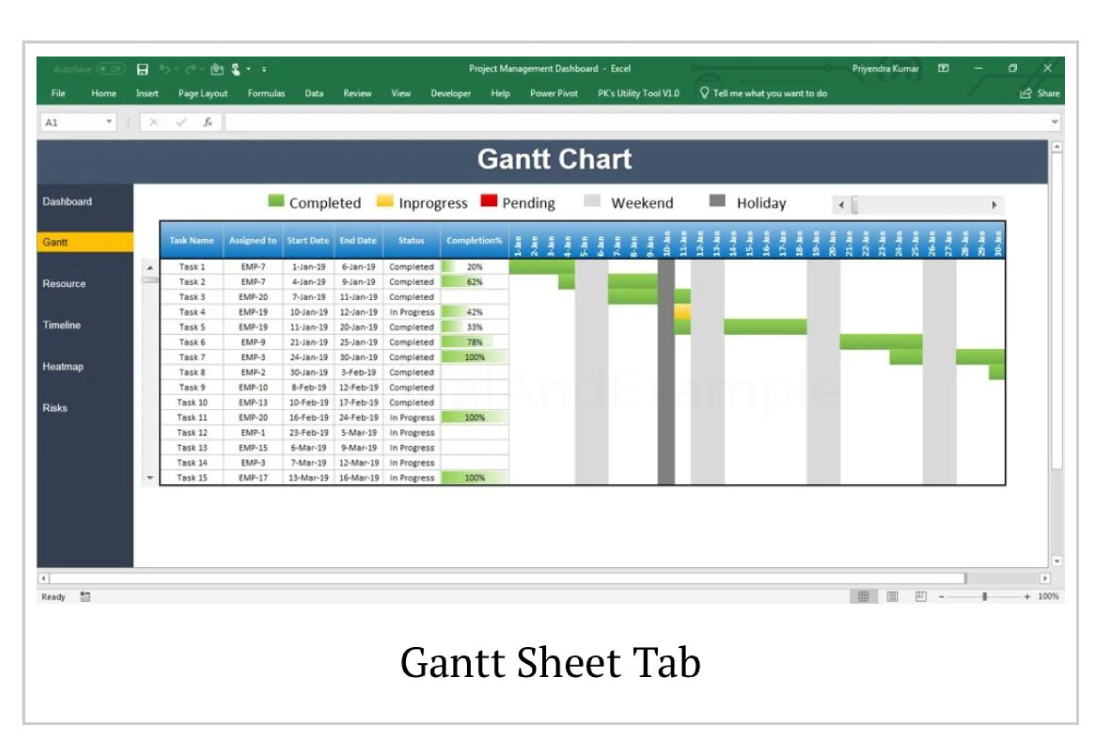
Resource:We have the resource (employees) utilization shown on the Resource sheet tab. Here, we have made both horizontal and vertical scroll bars. The month may be slid using the horizontal scroll bar, and the employees can be slid using the vertical scroll bar. Names of employees are linked to the setting sheet. 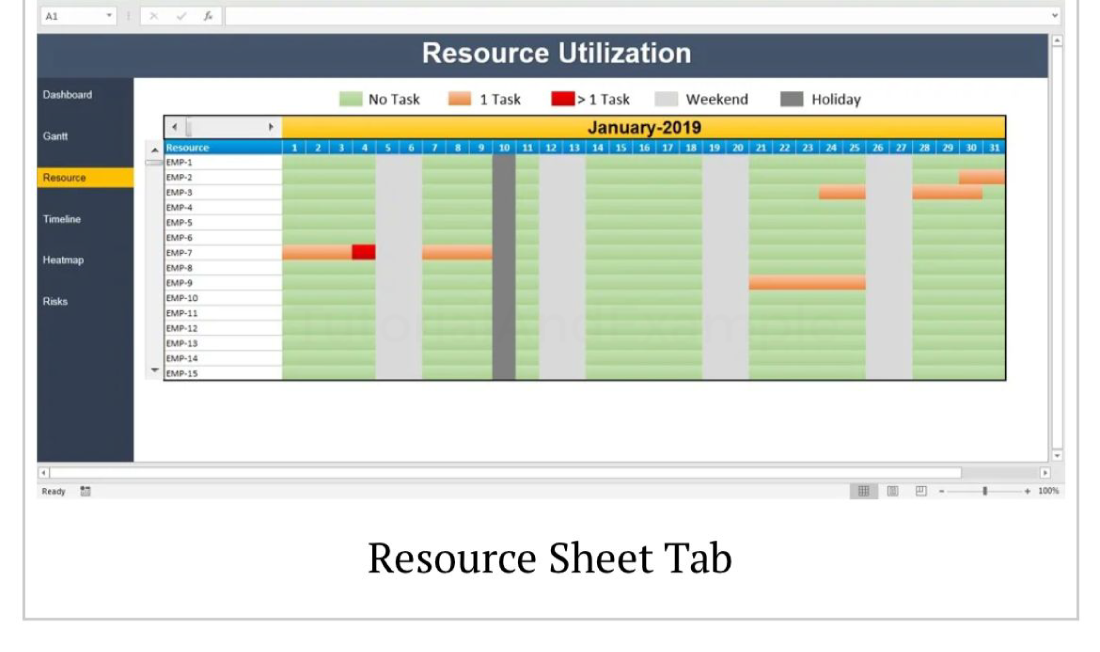
Timeline:We have made an interactive Timeline Chart on this sheet tab that is linked to a slicer. To show the tasks that are pending, completed, and in Progress, respectively, we have used the colours red, green, and amber. 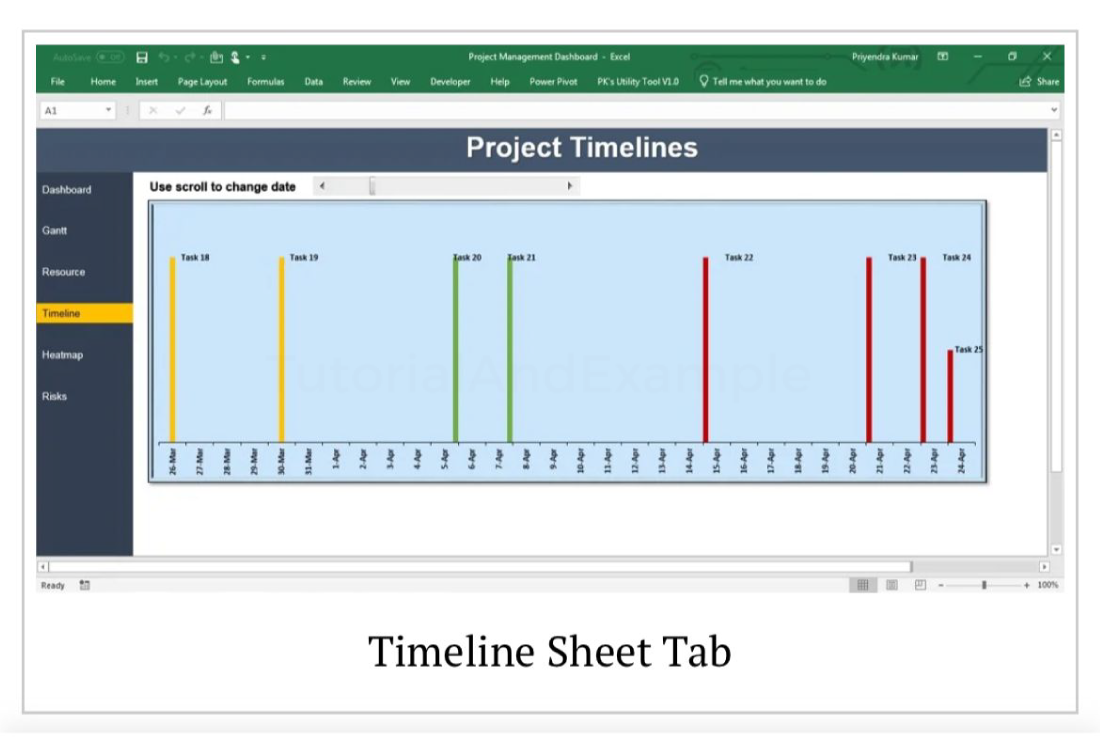
Heat Map:We have made a dynamic annual Heat map table in the aforementioned tab, and you can spin the button to switch the year. 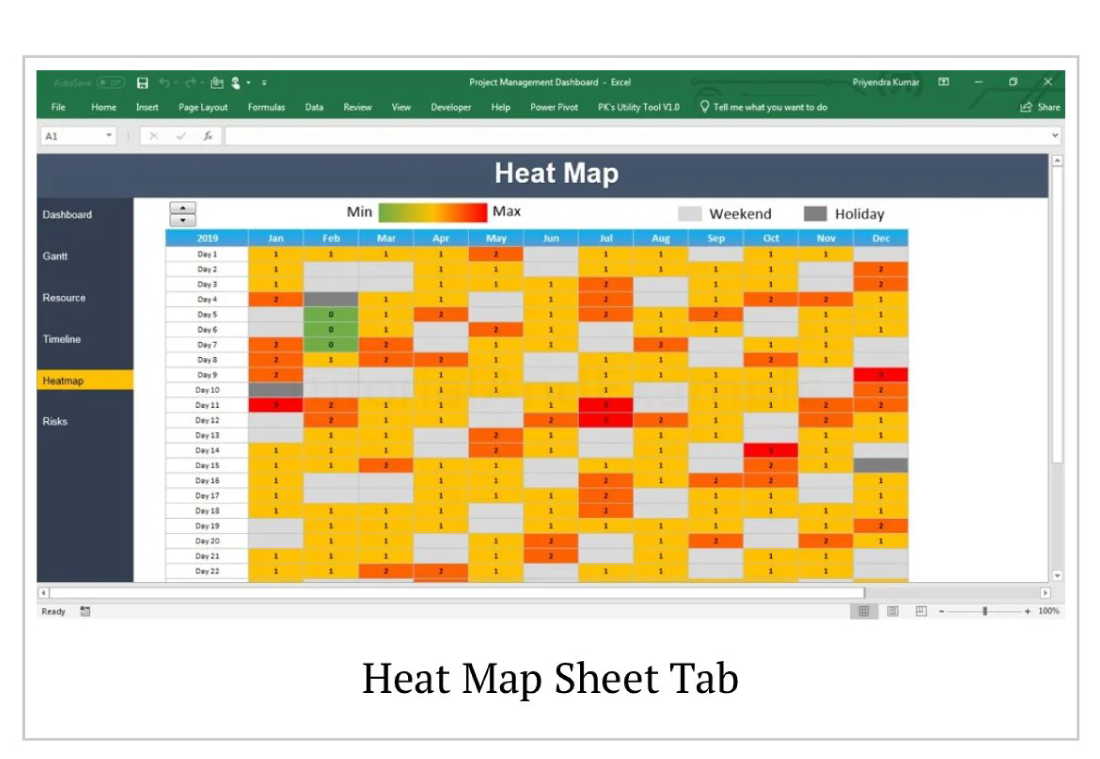
Conclusion:To sum up, the Excel Project Management Dashboard is an effective and adaptable tool for planning successful project outcomes. With its dynamic visual representations and carefully arranged worksheets, this dashboard gives project managers as well as stakeholders up-to-date information about tasks, deadlines, budgets, and any obstacles. Excel's customization features enable the dashboard to be customized to meet the specific requirements of any project, resulting in improved communication, transparency, and well-informed decision-making. A comprehensive picture of the project's state is produced by combining task lists, timetables, budget monitoring, and risk administration into a single Excel file. Consequently, the management of projects Dashboard plays a crucial role in promoting teamwork and attaining project success in addition to optimizing project management procedures. |
 For Videos Join Our Youtube Channel: Join Now
Feedback
- Send your Feedback to [email protected]
Help Others, Please Share


