| |
Python Tutorial
Python OOPs
Python MySQL
Python MongoDB
Python SQLite
Python Questions
Plotly
Python Tkinter (GUI)
Python Web Blocker
Python MCQ
Related Tutorials
Python Programs

3D Scatter Plotting in Python using MatplotlibWhat is Matplotlib?Matplotlib is a library in Python which is used to create static and dynamic animation and plots with its inbuilt functions. It has a lot of inbuilt features and built-in analysis tools for analyzing any figure or graph. If we want to plot any three-dimensional figure then we can use the Matplotlib library. When we have a huge dataset of three-dimensional variables, and we plot its figure then it looks very scattered, and this is called a 3D scatter plot. We will use Matplotlib's matplot3d toolkit to draw the three-dimensional figure. There is an ax.scatterd3D() function which accepts the dataset of coordinates X, Y and Z. It takes many more arguments based on attributes we want to give to our three-dimensional plot. When Matplotlib was first created, only two-dimensional plotting was considered. A practical (albeit rather constrained) collection of tools for three-dimensional data visualization was created around the time of the 1.0 release by layering some three-dimensional charting utilities on top of Matplotlib's two-dimensional display. By importing the mplot3d toolkit, which is part of the basic Matplotlib installation, three-dimensional charts are made possible. The simplest three-dimensional plot is a scatter plot made up of lines or clusters of (x, y, z) triples. These can be produced using the ax.plot3D and ax.scatter3D functions, much like the more typical two-dimensional chart that were previously presented. These have a call signature that is remarkably similar to their two-dimensional counterparts. To create the illusion of depth on the page, the scatter points' transparency has been altered. Example 1:Output: 
Explanation: In the above example, we have created the three-dimensional plot using the ax.scatter() function. We have initially imported all the libraries we required, like numpy,matplotlib and mpl_toolkits. Then, we have created the datasets for x,y and z coordinates of random numbers using the randInt() function. After that we have used the ax.scatter3D() function and put x,y and z coordinates, and we took red color for the points. At the end, we display the plot using the show() function. Example 2:Output: 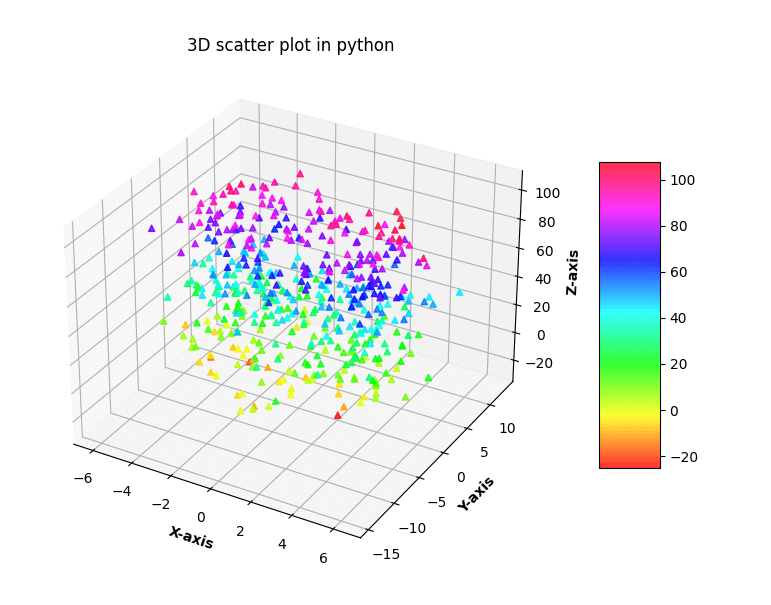
Explanation: In the above code, we have plotted the three-dimensional plot with the function ax.scatter3D() function. We have generated the random datasets for the x,y and z coordinates and plotted them using marker '^'. We use the set_label function to give the labels to respective axes. Example 3:Output: 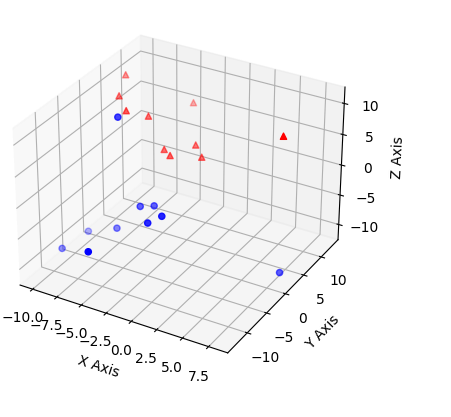
Explanation: In the above example, we have plotted the two 3-D dimensional datasets simultaneously in the same code. For the first three-dimensional plot, we have chosen the blue color for the points and '^' as the marker for the points in the figure. In the same way for the second plot, we have chosen the red color for the points and 'o' as the marker of the points in the figure.
Next TopicFunction Annotations in Python
|
 For Videos Join Our Youtube Channel: Join Now
Feedback
- Send your Feedback to [email protected]
Help Others, Please Share


