| |

Python NetworkXIn this tutorial, let's explore the NetworkX library of Python. NetworkX represents network examination in Python. NetworkX is a module of Python for the control, creation, and investigation of the elements, construction, and intricate network elements. It is utilized to make, control, and concentrate on complex charts. IntroductionNetworkX is a Python language programming module investigating perplexing organizations' element design and capability. It is utilized to concentrate on enormous, complex organizations addressed in charts with nodes and edges. Utilizing networks, we can load and store complex organizations. We can produce many arbitrary and exemplary organizations, break down network structures, construct network models, plan new organization calculations and draw organizations. NetworkX is free programming delivered under the BSD-new permit. Prerequisites Required: Basic knowledge of the foundation of Python programming and graph theory of mathematics. Highlights of NetworkX
Appropriateness NetworkX is appropriate for the procedure on enormous certifiable charts: e.g., diagrams of more than 20 billion nodes and 200 billion edges.[clarification needed] Due to its reliance on an unadulterated Python "word reference of word reference" information structure, NetworkX is a sensibly effective, entirely versatile, profoundly compact system for organization and informal organization examination. InstallationOn the off chance that the NetworkX package isn't introduced in your framework, you need to introduce it right away. You can install it by utilizing the accompanying command below: The command above will introduce the NetworkX bundle in your framework. Presently, you are prepared to utilize it. Once in a while, the above order might give a blunder message. You are informed to utilize pip3 order rather regarding pip. It relies heavily on how your framework is designed. Importing the LibraryYou can utilize the 'networkx' module by bringing it utilizing the accompanying command: Presently, the 'networkx' module is accessible with the reference 'nxx'. You can utilize any reference name; however, 'nxx' is the most regularly used reference for the 'networkx' module in Python. Various Operations Performed using NetworkX Python ModuleCreating a full empty graphUse the accompanying command to create any empty graph The command above will create an empty graph. An empty graph has an empty edge set and an empty vertex set. To access the edge set and the vertex set of the graph G1, we can utilize the accompanying command: Both G1.nodes() and G1.edges return lists of Python. G1.nodes() and G1.commands will return null records since we have not added any nodes or edges to diagram G1. Adding nodes to the graphTo start, we will make an unfilled chart by calling Graph() class as displayed beneath. A node in NetworkX can be any hashable item, i.e., a number, a text string, a picture, an XML object, etc. It very well may be a NetworkX diagram, moreover. There are two techniques used to add nodes in the diagram. add_node(): This strategy is utilized to add one single node at a time. add_nodes_from(): This technique takes an iterable compartment like rundown, set, and so forth and adds numerous nodes simultaneously. Source Code: Output: [1, 2, 3, 'node 5'] Adding edges to the graphThese two strategies are significantly used to add edges to the chart. An edge is like a connection between two nodes. Obscure nodes determined in the boundaries are consequently added to the chart. add_edges_from(): This strategy takes an iterable holder of edges tuples like rundown, iterator, and so on. add_edge(): This strategy adds each edge in turn. Adding an edge or a node again to the diagram will be quietly overlooked by NetworkX. Source Code: Output: [1, 2, 3, 4, 5] [(1, 2), (2, 3), (2, 4), (3, 5), (4, 5)] Remove Edges and Nodes from the given graph.Comparably to adding edges and nodes, we can eliminate single edges and nodes all at once and different edges and nodes at a time.
Source Code: Output: [1, 2, 3, 4, 5, 6, 7, 8] [(1, 2), (1, 4), (2, 3), (3, 4), (5, 6), (5, 7), (5, 8), (7, 8)] - - - - - - - - - - - - - - - - - - - - - - - - - - - - [1, 2, 3, 4, 5, 6, 7, 8] [(2, 3), (5, 6), (5, 7), (5, 8), (7, 8)] - - - - - - - - - - - - - - - - - - - - - - - - - - - - [1, 2, 3, 4, 6] [(2, 3)] Access element of a graphWe can get to 4 fundamental chart properties in the NetworkX diagram.
Source Code: Output:
Node - - - - - - - - - - - - - -- - - - - - -
[1, 2, 3, 5, 6]
Edge - - - - - - - - - - - - - - - - - - - - -
[(1, 2), (1, 3), (3, 5), (3, 6)]
Adjacency List- - - - - - - - - - - - - - - - - - - - -
{1: {2: {}, 3: {}}, 2: {1: {}}, 3: {1: {}, 5: {}, 6: {}}, 5: {3: {}}, 6: {3: {}}}
Degree- - - - - - - - - - - - - - - - - - - - -
[(1, 2), (2, 1), (3, 3), (5, 1), (6, 1)]
Adjacence Python List for node 3- - - - - - - - - - - - - -
{1: {}, 5: {}, 6: {}}
Degree for node 3- - - - - - -
3
Attributes for Graph, Nodes, and EdgesEach chart, node, and edge can hold key/esteem characteristic matches in a related quality word reference. Of course, these are vacant. However, qualities can be added or changed utilizing add_edge, add_node or direct control of the property word references named G.graph, G.nodes, and G.edges for a chart G. 1. Chart Attributes You can allot characteristics to diagram while making it utilizing nxx.Graph(). Source Code: Output:
{'graph_description': 'empty graph is created here'}
Or you can add/modify the attributes later, just like a dictionary object Source Code: Output:
Output: {'description': 'This is empty graph', 'data': 5}
2. Nodes Attribute You can add ascribes for node utilizing add_node(), add_nodes_from() or G.nodes. You can get it for all nodes utilizing G.nodes.data(). For a specific node, utilize square sections as displayed. Source Code: Output:
[(1, {'data': 'data11', 'type': 'root node'}), (2, {'node_type': 'children node', 'data': 'data22'}), (3, {'node_type': 'children node', 'data': 'data33'})]
 {'data': 'data11', 'type': 'root node'}
3. Edges Attribute - Make a weighted edge graph You can add ascribes for edges utilizing add_edge(), add_edges_from(), G.edges or addendum documentation. We can make a weighted diagram as displayed by relegating credits to edges. Source Code: Output:
[(1, 2, {'weight_': 10}), (1, 3, {'weight_': 70}), (1, 4, {'weight_': 100}), (4, 5, {'weight_': 175})]
Visualize the NetworkX Package's GraphWe can draw diagrams and envision them in the NetworkX bundle utilizing the draw() technique as displayed. Source Code: Output: 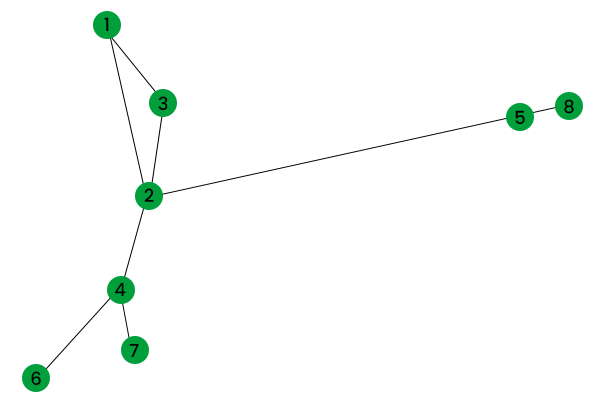
NetworkX Graph VisualizationIf you want to draw diagrams with loads, use draw_networkx_edge_labels() alongside nxx.draw() indicating the chart, pos and edge_label credits. Source Code: Output: 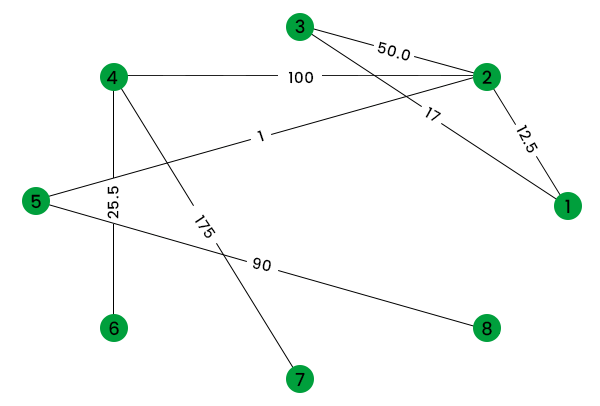
Figure: NetworkX Graph Visualization with Weights Creating Directed Graphs using the NetworkX PackageNetworkX likewise permits you to make coordinated charts utilizing the DiGraph() class which gives extra strategies and properties intended for coordinated edges, e.g., DiGraph.out_edges, DiGraph.in_degree, DiGraph.predecessors(), DiGraph.successors() and so on. Source Code: Output: Out edges of node 4 are: [(4, 5), (4, 6)] In Degree of node 2 is: 2 Successors of node 4 are: [5, 6] Predecessors of node 2 are: [1, 5] 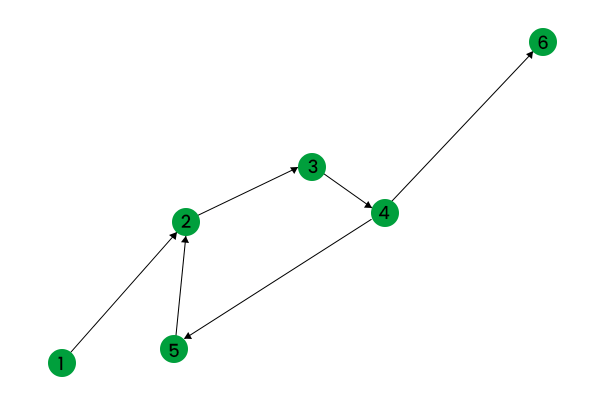
Figure: NetworkX Directed Graph ConclusionIn this instructional exercise, you learned about NetworkX bundle and how to utilize it to make, control and imagine charts. This library becomes supportive in concentrating on complex organizations and charts. It is utilized by mathematicians, physicists, researchers, PC researchers, and so on for study. Gratitude for perusing!!
Next TopicSklearn Logistic Regression
|
 For Videos Join Our Youtube Channel: Join Now
Feedback
- Send your Feedback to [email protected]
Help Others, Please Share


