Javatpoint Logo
Javatpoint Logo

How to Plot glyphs over a Google Map by using Bokeh Library in Python

Bokeh is an Interactive Data visualization library of Python. It creates its plots by using HTML and JavaScript languages. Its basic targets are modern website browsers for presenting provided elegance, concise construction of novel graphics with high-performance interactivity.

The bokeh library is used for plotting glyphs over a Google map. A glyph is a hieroglyphic symbol or a character. For using Google Maps in Bokeh, we can use the gmap() function of the bokeh.plotting class.

gmap()

Syntax:

Parameters:

  • google_api_key: It is a key of the Google API
  • map_options: GmapOptions, that is, the configuration which is specific to the Google map
  • active_drag: It is a dragging tool that has to be initially active.
  • active_inspect: It is an inspecting tool that has to be initially active.
  • active_scroll: It is a scrolling tool that has to be initially active.
  • active_tap: It is a tapping tool that has to be initially active.
  • title: It is the title of the Google map.
  • tools: These are tools with which the plot should start.
  • x_axis_label: It is used for labelling the x-axis
  • x_axis_location: It is a location of the x-axis
  • x_minor_ticks: These are the number of minor ticks between adjacent x-axis major ticks
  • y_axis_label: It is used for labelling the y-axis
  • y_axis_location: It is a location of the y-axis
  • y_minor_ticks: These are the number of minor ticks between adjacent y-axis major ticks

Returns:

It will return an object of the class GMap

GMapOptions()

Syntax:

Parameters:

  • lat: It is used for the latitude where the Google map is to be centred.
  • lng: It is used for longitude where the Google map is to be centred.
  • map_type: It defines the type of Google maps to use for the plot. Here are the four types of maps available:
    • -Hybrid
    • -Roadmap
    • -Satellite
    • -Terrain
  • name: It is the name for the Google map.
  • scale_control: It defines whether the Google map should display its distance scale control.
  • styles: It is used for defining the style of map to be used for the plot.
  • subscribed_events: The is used for defining the list of events that are subscribed to by Python callbacks.
  • tags: These are the tags linked with the Google map model.
  • tilt: It is used for tilting the angle of the map.
  • zoom: It is an initial zoom level of the Google map.
  • apply_theme: It is a theme of the model.

Returns:

It returns an object of the class GMapOptions

Steps for plotting glyphs over a Google map:

Step 1: Import the following modules and libraries:

  • gmap from bokeh.plotting
  • ColumnDataSource from bokeh.models
  • GmapOptions from bokeh.models
  • output_file from bokeh.io
  • show from bokeh.io

Step 2: Create a file for storing the model by using the output_file()

Step 3: Configure Google map by using GMapOptions()

Step 4: Generate a Google map object by using the gmap()

Step 5: Define the coordinates of the glyphs y using the ColumnDataSource()

Step 6: Generate the glyphs on the above created object of Google Maps.

Step 7: Display the output of Google Maps by using the show()

Code:

Output:
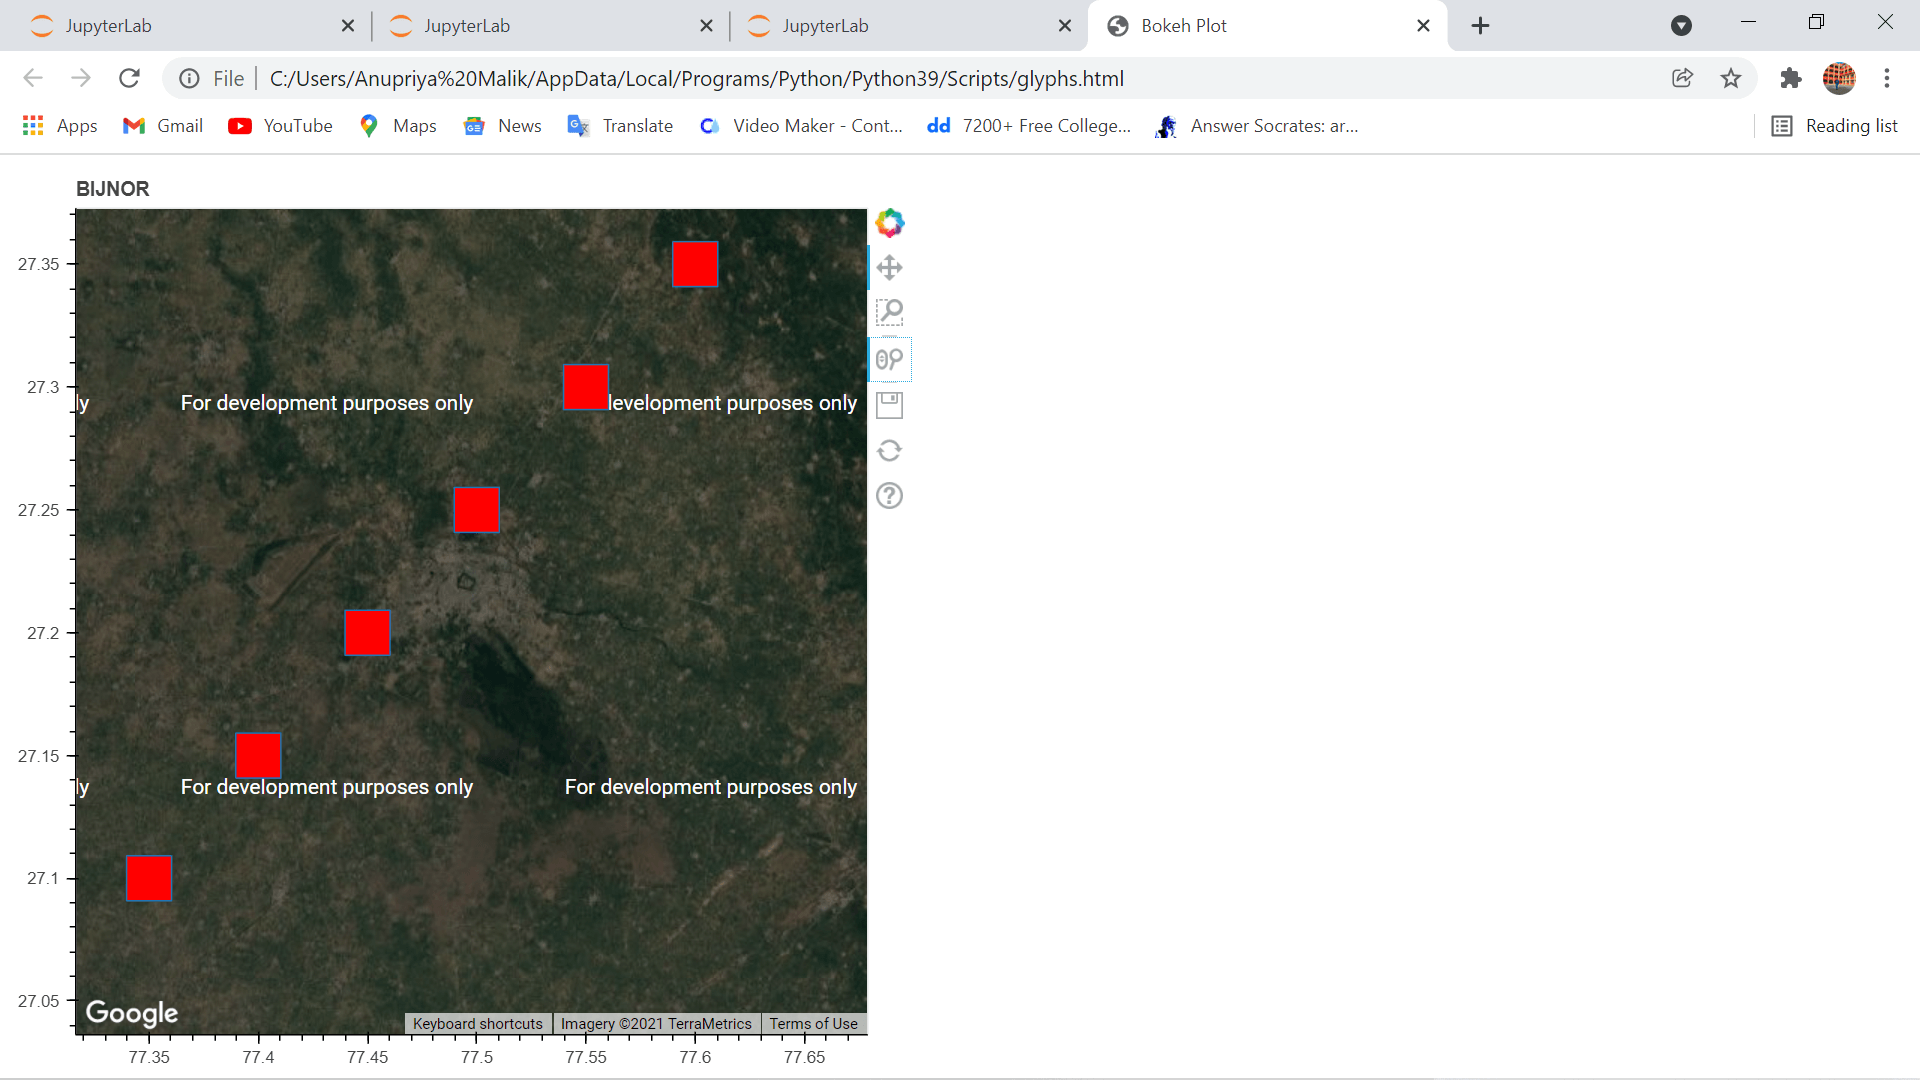
How to Plot glyphs over a Google Map by using Bokeh Library in Python

Conclusion

In this tutorial, we have discussed how we can plot glyphs over a Google Map by using the Bokeh library in Python.


Youtube For Videos Join Our Youtube Channel: Join Now

Feedback


Help Others, Please Share

facebook twitter pinterest

Learn Latest Tutorials


Preparation


Trending Technologies


B.Tech / MCA