| |
Python Tutorial
Python OOPs
Python MySQL
Python MongoDB
Python SQLite
Python Questions
Plotly
Python Tkinter (GUI)
Python Web Blocker
Python MCQ
Related Tutorials
Python Programs

Data Visualization Using TuriCreate in PythonData Visualization is a crucial stage in Machine Learning. To fully comprehend the behavior and characteristics of your data, you must first visualize it. Python provides different libraries for data visualization. Turicreate is one of the best libraries provided by Python for Data Visualization. TuriCreate can be used for both supervised and unsupervised learning models. It can be used for regression problems, clustering, and classification problems. Its main aim is to build the model instead of the algorithm used. It offers multiple tools which are readily available for deploying the model. It makes the custom machine learning models easier. There is no need to be an expert in machine learning to develop models and add the features like recommendation, object detection, etc., in the app. This library can be used in place of scikit-learn. Let's see a few terminologies related to data visualization with the Turicreate library in Python.
Why Use TuriCreate in Python?We can choose the Turi Create library for Machine Learning models as:
The turicreate library can be installed using the following: We can make charts and plots like Bar plots, Scatter plots, Heatmap, Box plots, etc. Let's start visualizing data and make different charts and graphs using the TuriCreate library in Python. We will take a simple House Price Prediction data set from the kaggle website for the visualization. The link for the dataset is House Data Prediction. Different Charts and Graphs in TuricreateThe first step in data visualization is to import the turicreate library. Then we will explore the dataset and make various charts and graphs. We have imported the turicreate library. Using the SFrame, we have read the CSV file. Now, we will make different charts and graphs to visualize the dataset. 1. Bar Chart Output: 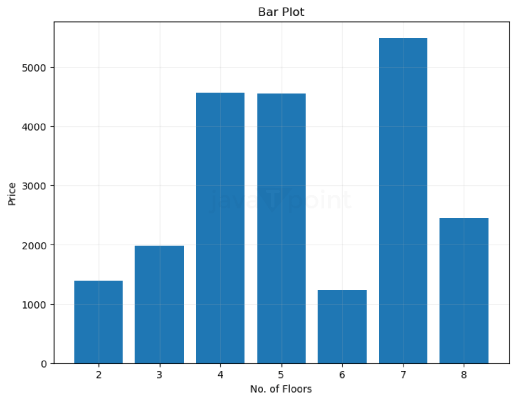
2. Scatter plot Output: 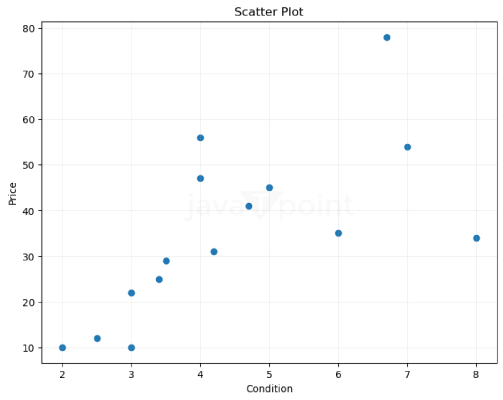
3. Box Plot: Output: 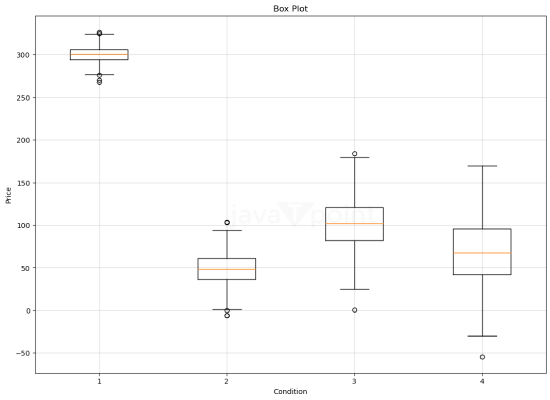
4. Histogram Output: 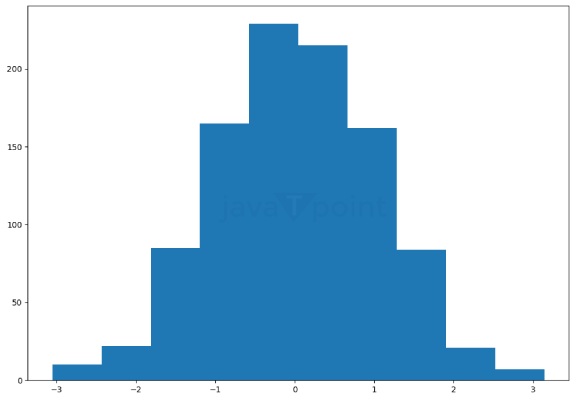
|
 For Videos Join Our Youtube Channel: Join Now
Feedback
- Send your Feedback to [email protected]
Help Others, Please Share


