| |
Python Tutorial
Python OOPs
Python MySQL
Python MongoDB
Python SQLite
Python Questions
Plotly
Python Tkinter (GUI)
Python Web Blocker
Python MCQ
Related Tutorials
Python Programs

Implementation of Linear Regression using PythonLinear regression is a statistical technique to describe relationships between dependent variables with a number of independent variables. This tutorial will discuss the basic concepts of linear regression as well as its application within Python. In order to give an understanding of the basics of the concept of linear regression, we begin with the most basic form of linear regression, i.e., "Simple linear regression". Simple Linear RegressionSimple linear regression (SLR) is a method to predict a response using one feature. It is believed that both variables are linearly linked. Thus, we strive to find a linear equation that can predict an answer value(y) as precisely as possible in relation to features or the independently derived variable(x). Let's consider a dataset in which we have a number of responses y per feature x: 
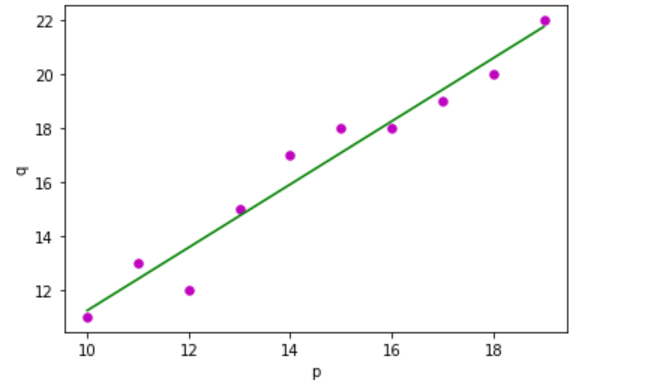
For simplification, we define: x as feature vector, i.e., x = [x1, x2, x3, …., xn], y as response vector, i.e., y = [y1, y2, y3 …., yn] for n observations (in above example, n = 10). A scatter plot of the above dataset looks like: - 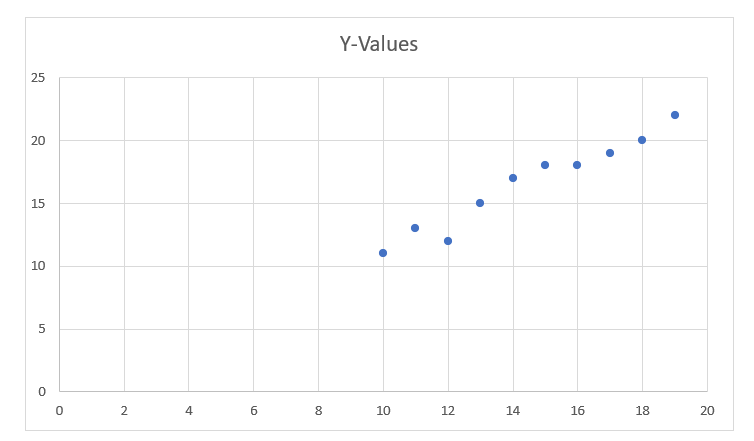
The next step is to identify the line that is most suitable for this scatter graph so that we can anticipate the response of any new value for a feature. (i.e., the value of x is that is not in the dataset) This line is referred to as the regression line. The equation of the regression line can be shown as follows: 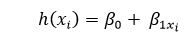
Here,
In order to build our model, we need to "learn" or estimate the value of the regression coefficients and . After we've determined those coefficients, then we are able to make use of this model in order to forecast the response! In this tutorial, we're going to employ the concept of Least Squares. Let's consider: yi = ?0+ ?1xi + ?i=h(xi )+ ?i ? ?i= yi- h(xi ) Here, ?i is a residual error in ith observation. So, our goal is to minimize the total residual error. We have defined the cost function or squared error, J as: 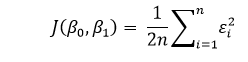
and our mission is to find the value of ?0 and ?1 for which J(?0,?1) is minimum. Without going into the mathematical details, we are presenting the result below: 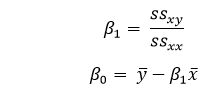
Where, ssxy would be the sum of the cross deviations of "y" and "x": 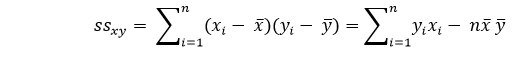
And ssxx would be the sum of squared deviations of "x" 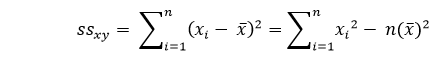
Code: Output: Estimated coefficients are : b_0 = -0.4606060606060609 b_1 = 1.1696969696969697 Multiple linear regressionMultiple linear regression attempts explain how the relationships are among several elements and then respond by applying a linear equation with the data. Clearly, it's not anything more than an extension of linear regression. Imagine a set of data that has one or more features (or independent variables) as well as one response (or dependent variable). The dataset also is comprised of additional n rows/observations. We define: X(Feature Matrix) = it is a matrix of size "n * p" where "xij" represents the values of jth attribute for the ith observation. Therefore, 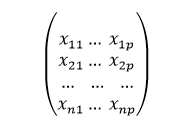
And, y (Response Vector) = It is a vector of size n where represents the value of response for the ith observation. 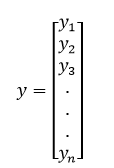
The regression line for "p" features are represented as: 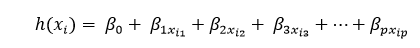
Where h(xi) is the predicted response value for the ith observation point and ?0,?1,?2,....,?p are the regression coefficients. We can also write: 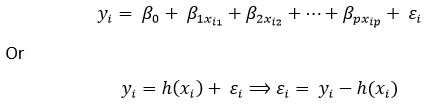
Where, ?i is representing the residual error in the ith observation point. We can also generalize our linear model a little more by representing the attribute matrix of "X" as: 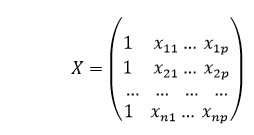
Therefore, the linear model can be expressed in the terms of matrices as shown below: y=X?+? Where, 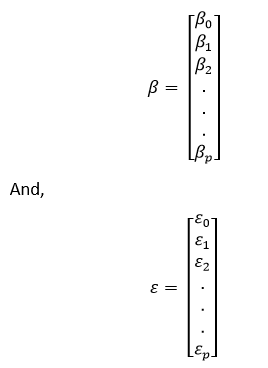
We now determine an estimation of the b, i.e., b' by with an algorithm called the Least Squares method. As previously mentioned, this Least Squares method is used to find b' for the case where the residual error of total is minimized. We will present the results as shown below: 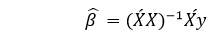
Where ' is the matrix's transpose and -1 is the matrix's that is the reverse. With the help of the lowest square estimates b', the multi-linear regression model is now calculated by: 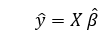
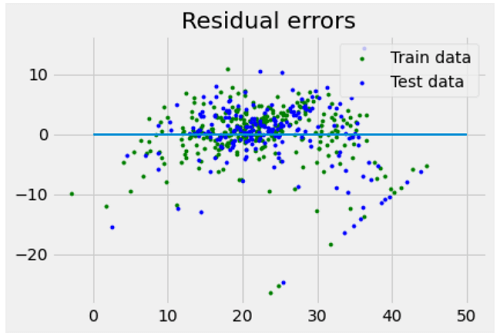
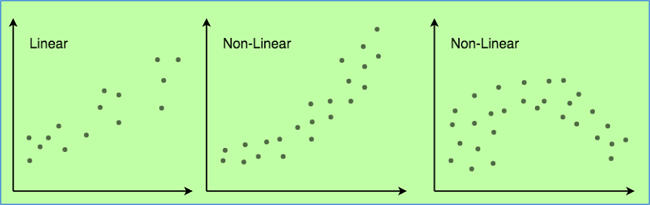
where y' is the estimated response vector. Code: Output: Regression Coefficients are: [-8.95714048e-02 6.73132853e-02 5.04649248e-02 2.18579583e+00 -1.72053975e+01 3.63606995e+00 2.05579939e-03 -1.36602886e+00 2.89576718e-01 -1.22700072e-02 -8.34881849e-01 9.40360790e-03 -5.04008320e-01] Variance score is: 0.7209056672661751 In the above example, we calculate the accuracy score using the Explained Variance Score. We define: explained_variance_score = 1 - Var{y - y'}/Var{y} where y' is the estimated output target, where y is the equivalent (correct) to the target's output, where Var is Variance, which is the square of the standard deviation. The most ideal score is 1.0. Lower scores are worse. Assumptions:Here are the main assumptions that the linear regression model is based on with regard to the dataset on the basis on which it is utilized:
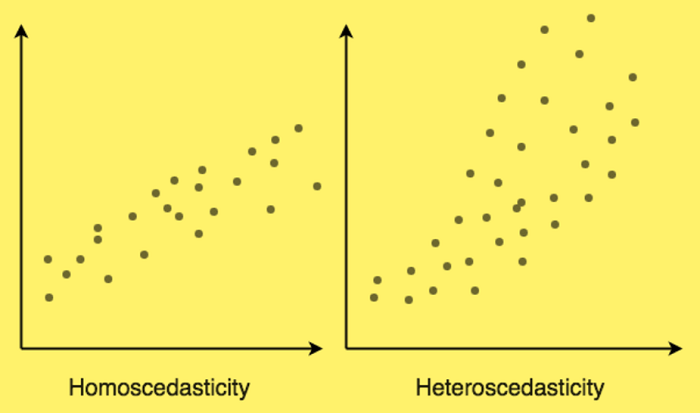
At the end of the tutorial, we'll discuss some of the applications of linear regression. Applications:Following are the fields of applications based on Linear Regression:
Next TopicNested Decorators in Python
|
 For Videos Join Our Youtube Channel: Join Now
Feedback
- Send your Feedback to [email protected]
Help Others, Please Share


