| |

Python PyLab ModuleWhile performing some tasks, we have to use graphs like line charts, bar graphs, etc., for many reasons like to make the task more interactive, to pass the information in a very interesting way, graphs are easy and self-explanatory, etc. That's why plotting a graph or chart is a very important and integrated part of many functions. Graphs and charts play a very important role in the field of programming, and developers are always recommended for using graphs in their programs. Therefore, it becomes very important that we should be aware of how we can plot graphs from a program. MATLAB is considered the best to plot graphs and charts, but it is not possible for everyone to use MATLAB for plotting graphs & charts. We have many interactive modules present in Python that allow us to plot graphs and charts in the output, but here we will talk about the module, which provides us a MATLAB-like namespace by importing functions. We will talk about the PyLab Module of Python in this tutorial, and we will learn how we can plot graphs and chart in the output using functions of this module in a program. PyLab Module in PythonPyLab is a Python package that provides us a namespace in Python programming, which is very similar to MATLAB interface, by importing the functions from Python Numpy and Matplotlib Module. If we talk about these modules' role in the PyLab package, Matplotlib Module provides functions that help us to create visualizations of data, whereas the Numpy Module provides efficient numerical vector calculation functions that are based on underlying C and Fortran binary libraries. We will learn about PyLab Module in this section, and we will then plot some basic graphs and charts using the elements & functions which this module provides to us. PyLab Module: IntroductionPyLab Module is an associated module with the Matplotlib Module of Python, and it gets installed alongside when we are installing Matplotlib Module in our system. We can also say that PyLab is a procedural interface of the Matplotlib Module, an object-oriented plotting library of Python. PyLab in itself is a convincing module for us because its bulky import the NumPy Module's functions and matplotlib.pyplot package in a single namespace to provide us a MATLAB-like namespace. PyLab Module: InstallationAs we have already discussed, the PyLab Module gets installed alongside the installation of the Matplotlib package. Still, if we want to use this module in a Python program, we should make sure that Matplotlib Module is present in our system. If Matplotlib is not present in the system, then we can use the following pip installer command in the command prompt terminal shell to install Matplotlib Module to get the PyLab Module with it: Other than this, we have also discussed that PyLab Module also uses the mathematical and vector operation functions from the Numpy Module. Therefore, we have to make sure that Numpy Module is also present in our system, and if it is not installed, then we can use the following command to install the numpy module from the command prompt terminal: We have installed all the requisite libraries for the PyLab Module, and now we can use the PyLab Module in the Python programs to plot graphs and charts from its functions. PyLab Module: ImplementationHere, we will use the functions of the PyLab Module to plot simple curves and graphs by using them inside a Python program to understand its implementation. We will first start with the basic plotting of curves, and then we will use some advanced functions to make the plotted graphs and curves more interactive. Basic plotting with PyLab Module:Plotting curves using the PyLab Module in a Python program requires the use of a plot command, and this command takes a pair of arrays or sequences having the same length. Let's understand this implementation through an example program. Example: Look at the following Python program from which we will plot a basic curve in the output: Output: 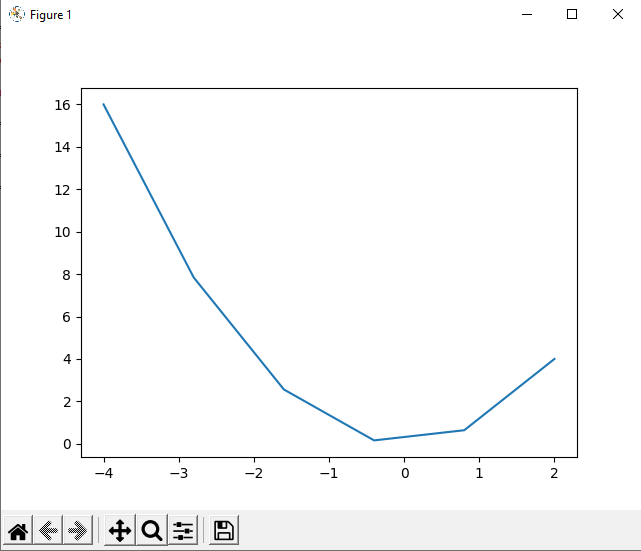
Explanation: We have first imported all the functions from the Numpy and PyLab Module to use them in the program for plotting a curve in the output. After that, we have defined the X and Y-axis for the curve in the a & b variable, respectively. Then, we used the plot() function and provided a and b variables as arguments. In last, we used the show() function to display the curve we plotted in the output. As we can see in the output that the curve is displayed with the X and Y-axis points, we have defined inside 'a' and 'b' variables, respectively. Advance Plotting with PyLab Module:1. We can use some arguments in the plot() function along with the x and y variable arguments we are providing inside it to plot more interactive curves using the PyLab Module. We have to provide additional string arguments inside the plot() function to print symbol lines instead of the straight line in the curves. We can understand this by using the additional argument in the following example program: Example 2: Look at the following Python program where we will plot a curve in the output having symbols, using the PyLab Module: Output: 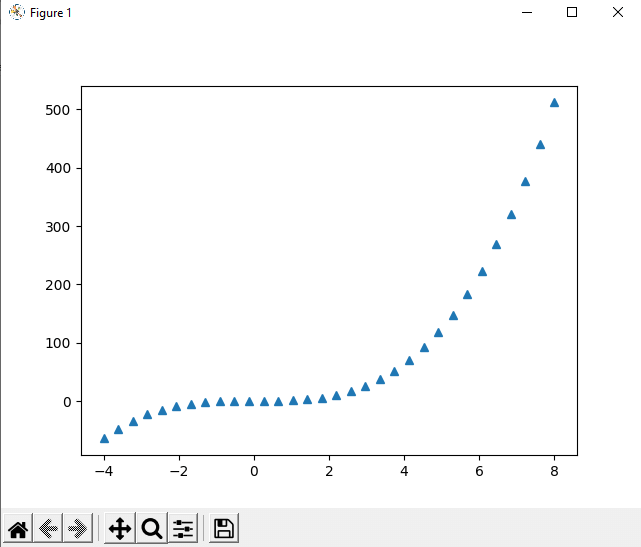
Explanation: After importing functions from both Numpy and PyLab Module in the program, we have defined the 'a' and 'b' variables for the X and Y-axis of the curve, respectively. After that, we have used the plot() function, and inside the plot function, we have provided an additional argument of the '^' symbol with the a & b variable to show the curve with a symbol instead of a simple straight line. As we can see in the output that the curve is displayed with the X and Y-axis points, we have defined inside 'a' and 'b' variable, respectively, and it has the '^' symbol instead of a straight line. We can use the following set of symbols as the argument inside the plot() function if we want to print a symbol line instead of a straight line in the curve:
2. Other than this, if we want, we can also print the lines with other colors than the default color plotted in the output curve, and for performing this task, we have to follow the same set of instructions. We have to use the color argument as an additional argument inside the plot() function so that the line of curve printed in the output will be printed in the color of our choice. We can understand this by using the additional argument in the following example program: Example 3: Look at the following Python program where we will plot a curve in the output having a colorful line, using the PyLab Module: Output: 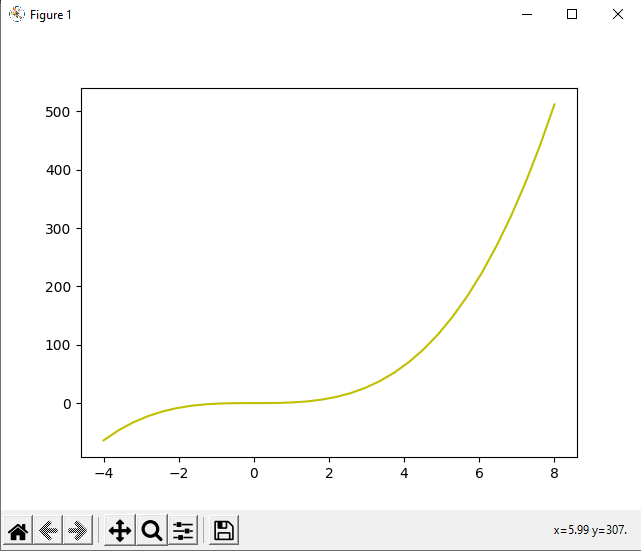
Explanation: We have used the same logic in this program as we have used in the program given in the previous example. We have used the color argument in the plot() function of this program to print the curve having a colorful line in the output. Last, we used the show() function to display the curve with our customized variable in the output. As we can see in the output that the curve is displayed with the X and Y-axis points, we have defined inside the 'a' and 'b' variable, respectively, and it has the yellow color line in it because we have given an additional color argument in the plot() function. We can use the following set of color codes as the additional argument inside the plot() function if we want to print a straight line having our choice of color in the curve:
4. Now, if you wonder whether we can perform both the operation (printing a symbol line instead of a straight line and printing it with the color of choice) simultaneously or not, the answer is yes. We can perform both the task simultaneously, and we just have to provide both the arguments together as a single additional argument like '_y' inside the plot() function. Then, it will perform both the operations simultaneously, and a curve having a symbol line with the color of our choice will be printed in the output. We can understand this by using the additional argument in the following example program: Example 4: Look at the following Python program where we will plot a curve in the output using the PyLab Module: Output: 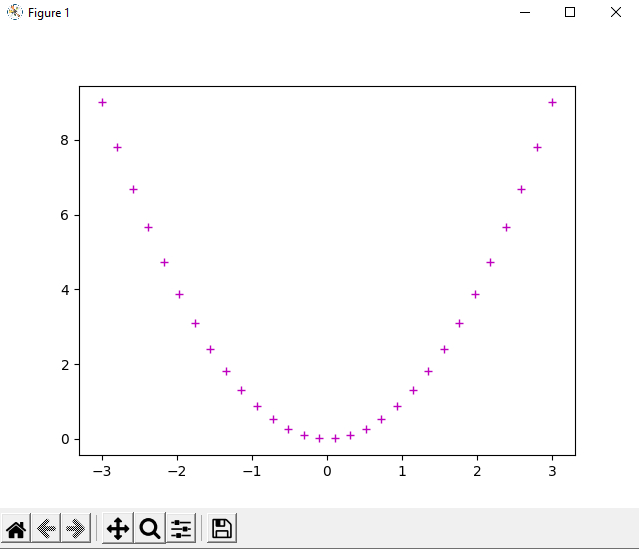
As we can see in the output, we have printed a curve having a colorful symbol line in the output. 4. In last, we can also print multiple curves inside and overlaid them under a single plot and for that we just have to use multiple plot() functions together in a program. We can understand this method through by using the multiple plot() function in the following example program: Example 5: Look at the following Python program where we have used plot() function multiple times to overlaid the curve: Output: 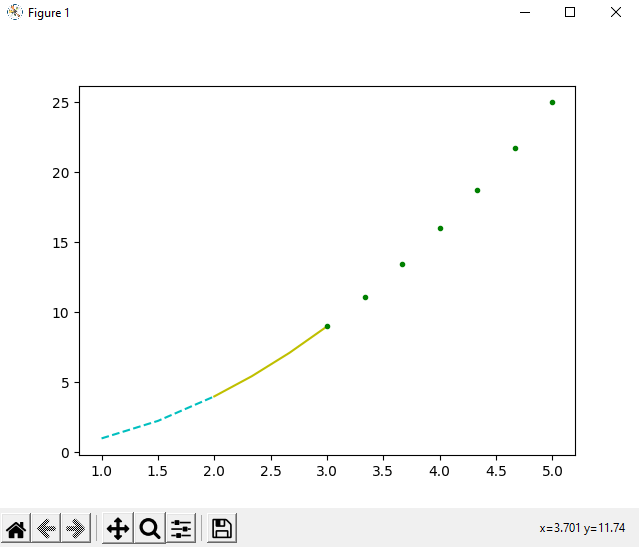
As we can see in the output that we have plotted multiple curves and overlaid them by using the plot() function multiple times in the program. ConclusionWe have learned about PyLab Module in this tutorial, where we learned that PyLab Module provides us a MATLAB-like namespace, and it is very helpful for plotting multipurpose curves using a Python program. We have plotted multiple types of curves in the output by importing functions from PyLab and Numpy Module in the program. After starting with basic plotting, we plotted curves having symbol line or/and color in line, and we overlaid curves.
Next TopicWorking with PDF files in Python
|
 For Videos Join Our Youtube Channel: Join Now
Feedback
- Send your Feedback to [email protected]
Help Others, Please Share


