| |
Python Tutorial
Python OOPs
Python MySQL
Python MongoDB
Python SQLite
Python Questions
Plotly
Python Tkinter (GUI)
Python Web Blocker
Python MCQ
Related Tutorials
Python Programs

Plot Line in PythonPython's Matplotlib module is used for data visualization. A set of methods called pyplot, a submodule of matplotlib, aids in creating several charts. The relationship between two sets of data, X and Y, is shown using line plots on a distinct axis. Here, we'll look at a few Python line chart illustrations. Simple Line PlotsTo begin using the plotting methods, import the Matplotlib.pyplot library. Import the Numpy module as well, if necessary. Then specify the x and y data points. Code Output: 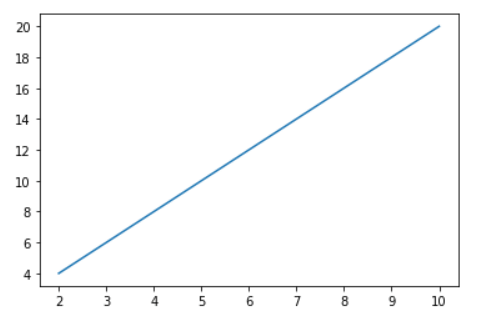
The x and the y-axis are not labeled, as seen in the output image up top, since labeling is based on recognizing the dimensions of the graph. In the following instance, we will demonstrate how to add axis labels and Ident in plots. Code Output: 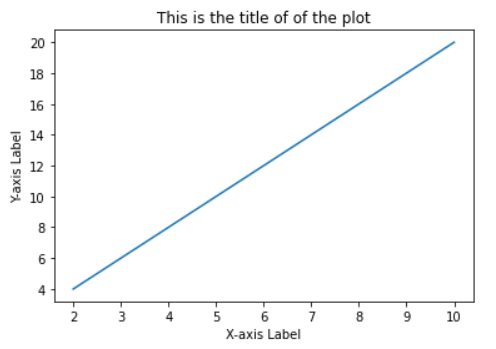
Multiple ChartsWe can display more than one chart in the same container with the pyplot.figure() method, we may display multiple charts in a single box. This will enable us to compare several charts and manage the appearance and feel of the graphs. Code Output: 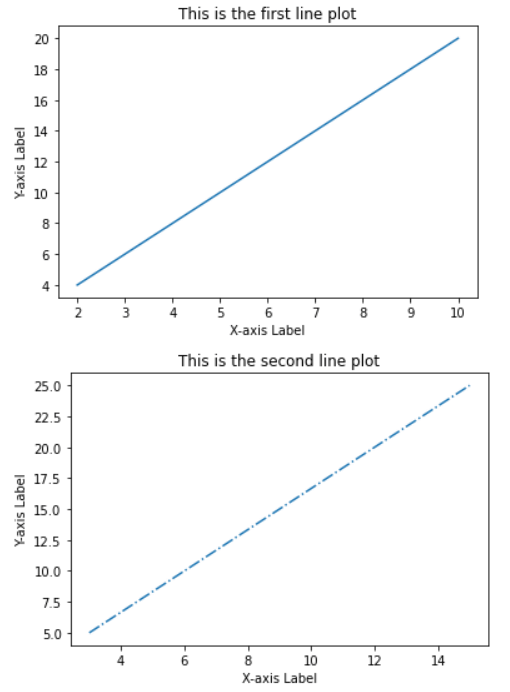
Dotted LineDots can represent lines, as seen in the illustration below. Use the scatter(x,y) technique rather than plot(x,y). The graph can also have points (randomly) plotted on it using the scatter(x,y) function. Code Output: 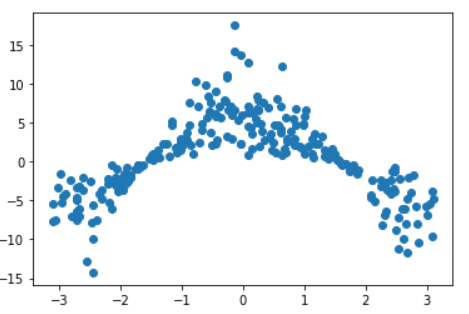
Line TicksWe can change the graph's ticks. Customize their color or place them on the y-axis. The line has a transparency level called the alpha value and can change the thickness. Code Output: 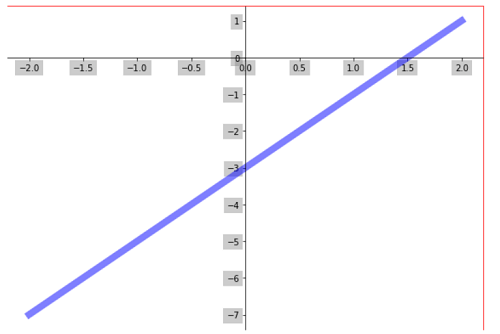
Line with AsymptoteThe line plot can include an asymptote. Use plt.annotate to accomplish it. A dotted line is also present in the following plot. To learn how the program functions, experiment with it. Code Output: 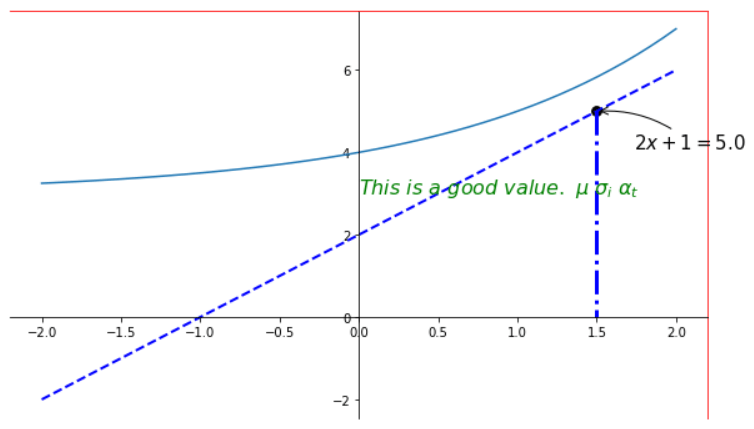
Line with Text ScaleIt is not required to use a numerical scale. Textual elements like those in the instance below may also be present in the scale. We simply supply a list of text values to plt.yticks(). The y-axis is then used to display these data. Code Output: 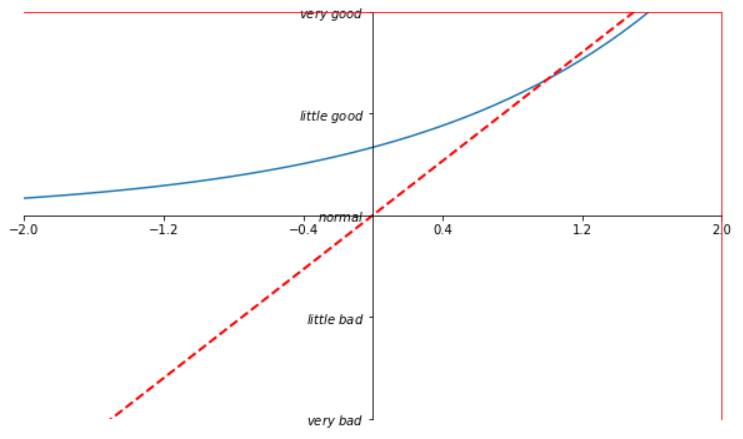
Multiple Plots on the Same AxisHere we will see how to add 2 plots within the same axis. Code Output: 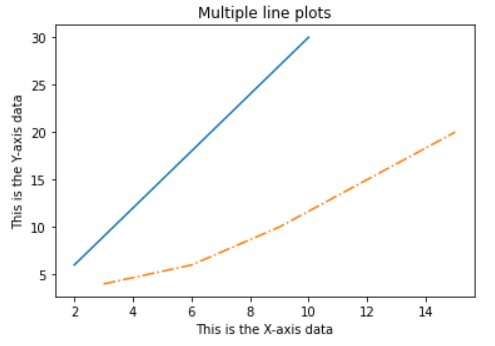
Next TopicPython Mutable Data Types
|
 For Videos Join Our Youtube Channel: Join Now
Feedback
- Send your Feedback to [email protected]
Help Others, Please Share


