| |

Collaborative Filtering and its Types in PythonThe most popular method for creating intelligent prediction models that get better at making recommendations as more data about users is gathered is called collaborative Filtering. Collaborative Filtering is used by the majority of websites, like Netflix, Amazon, YouTube, and YouTube, as part of their advanced recommendation algorithms. This method can create recommenders that make user recommendations based on their shared preferences. Collaborative Filtering: What Is It?With the help of collaborative filtering technology, users can exclude items based on the opinions of other users who share their interests. It operates by looking through a big group of people and identifying a smaller group of users with tastes comparable to a certain user. It considers the products they enjoy and combines them to produce a list of recommendations. Selecting similar users and combining their selections to get a list of suggestions can be done in various ways. This post will demonstrate how to use Python to accomplish that. DATASET:You will require data that includes a set of items and a set of users who have responded to some of the items to experiment with recommendation algorithms. Either the explicit (rating on a scale of 1 to 5, likes or dislikes) or the implicit response may occur (viewing an item, adding it to a wish list, the time spent on an article). When working with such data, you will typically see it in a matrix of user responses to various items from a collection of items. The user ratings would be listed in each row, and the object ratings would be listed in each column. An example of a matrix with five users and five objects would be: 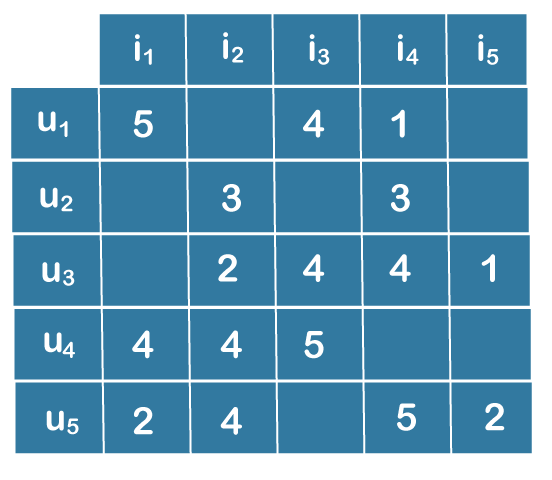
Rating Table
This dataset consists of numerous files detailing the movies, the users, and the ratings people have assigned to the films they have seen. The following are those that are noteworthy:
The item ID, timestamp, user ID, and rating are listed in a tab-separated list in the file u.data that holds the ratings. The file's opening few lines are as follows: 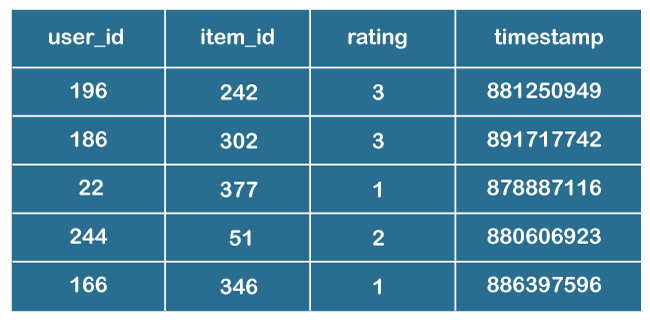
MovieLens 100k Data's First 5 Rows The file, as previously mentioned, contains the rating that a user assigned a specific movie. These 100,000 evaluations, which will be used to forecast user ratings for movies they haven't seen, are contained in this file. Collaborative Filtering ProcedureThe first stage in creating a system that can automatically suggest products to users based on the preferences of other users is to identify comparable individuals or products. The second step is predicting user ratings for things that still need to be rated. Consequently, you will require the following information:
Step 1:The answers to the first two questions are all different. A family of algorithms known as collaborative Filtering offers numerous methods for locating comparable users or things and numerous methods for determining ratings based on the ratings of comparable users. Depending on your decisions, you might choose a collaborative filtering strategy. In this post, you'll learn about the various methods for determining similarity and predicting ratings. Step 2:The age of users, the movie's genre, or any other information about users or objects are not used in an approach that relies solely on collaborative Filtering to determine how similar two items are. Step 3:It is only determined by the explicit or implicit rating a user provides a product. For instance, despite having a significant age gap, two users can be deemed comparable if they assign the same scores to ten films. Step 4:There are several ways to test the accuracy of your predictions, and the third issue likewise has many possible solutions, including error calculation methods that apply to other applications besides collaborative filtering recommenders. Step 5:The Root Mean Square Error (RMSE), which involves predicting ratings for a test dataset of user-item pairings whose rating values are previously known, is one method for gauging the accuracy of your conclusion. The error would be the discrepancy between the known value and the forecasted value. Finding the average (or mean) of the test set's error values, squaring them all, and then taking the square root of that average will yield the RMSE. Step 6:Mean Absolute Error (MAE), which finds the amount of error by obtaining its absolute value and then taking the average of all error values, is another statistic to gauge accuracy. Let's examine the many algorithms that make up the collaborative filtering family. Memory BasedThe first group of algorithms comprises memory-based ones that compute predictions using statistical methods on the complete dataset. The following steps are taken to determine the rating R a user U would assign to item I:
How to Find Comparable Users Using Ratings?Let's first construct a straightforward dataset to comprehend the idea of similarity. Four people named A, B, C, and D who have rated two films are included in the data. Lists are used to hold the ratings, and each list comprises two numbers that represent the rating of each film: Ratings from A are [1.0, 2.0], B [2.0, 4.0], C [2.5, 4.0], and [2.5, 4.0], and D ratings are [4.5, 5.0]. Plot the user ratings for two movies on a graph, then seek a pattern to get started with a visual cue. The graph appears as follows: 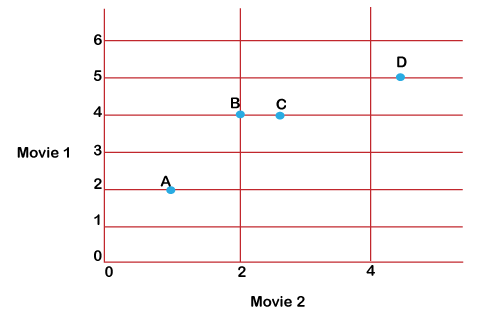
Each point in the graph above represents a user, and it is compared to the ratings they gave to two films. Measuring similarity by examining the distance seen between points is a good method. The formula for the Euclidean distance between two locations can be used to calculate the distance. The following program demonstrates how to use a scipy function: Source code: Explanation:As previously mentioned, you may use scipy.spatial.distance.euclidean to determine how far apart two points are from one another. Using it to determine how far the ratings of A1, B1, and D1 are from the rating of C1 reveals that the ratings of C1 are nearest to those of B1 in terms of distance. Even by simply looking at the graph, it is obvious that user C1 is closest to user B1. But who is C1 closest to, only between A1 and D1? In terms of distance, C is nearer to D1. However, based on the rankings, it would appear that C1's preferences would be more in line with A1's than D1's because both A1 and C1 enjoy the second film almost twice as much as they do the first. Can a judgment be made based on the angle formed by the lines connecting the spots to the origin? You can observe the angle formed by the lines connecting the graph's origin to each indicated spot as follows: 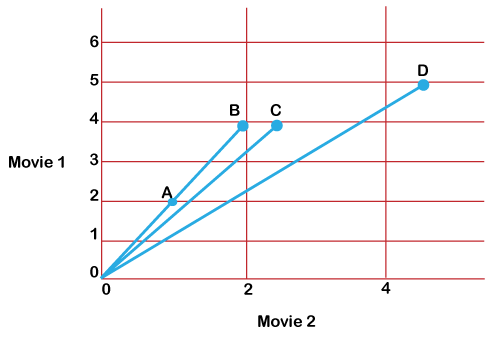
Four lines connect each point on the graph to the origin. Since A and B's lines coincide, there is no angle between them. You can assume that as the angle between the lines gets larger, the similarity between the users is smaller and that when the angle is zero, the users are quite similar. It would help if you had a function that yields a higher similarity or less distance for a lower elevation and a lower resemblance or larger range for a higher angle to calculate likeness using angle. As the angle grows from 0 to 180, the cos of an angle is a ratio that falls from 1 to -1. To determine how similar two users are, utilize the angle's cosine as a metric. The cosine will be lower, and the closeness of the users will be lower the higher the angle. Inverse the quantity of the sine of the angle by removing it from 1 to obtain the cosine range between the users. Source code: Explanation:
Observation: Observe that despite having differing ratings, users A and B are deemed to be identical by the cosine similarity metric. This frequently happens in reality, and users like User A are what you describe as difficult raters. An illustration would be a critic for a movie that consistently assigns lower ratings than the norm but whose list's rankings are comparable to those of ordinary raters like B. You must level the playing field for all users by eliminating any biases to consider such unique user preferences. You can achieve this by deducting from each item the user rated their average for all things. This is how it would appear:
By doing this, you have set the average user rating to be equal to zero. If you try the same thing with users C and D, you'll notice that the ratings have been changed to an average of 0 for all users, bringing them all to the same level and eliminating their biases. However, after modifying the values, the centered average for both users is 0, allowing you to more accurately capture whether an item is above or below average for both users by assigning the same value of 0 to all missing values in both users' vectors. Some methods you can use to locate people similar to one another-or even things-include Kl divergence and cosine similarity. (The function above determines cosine distance. Subtract the distance from 1 to obtain the cosine similarity.) Note: The centered cosine formula is the same as the Pearson correlation coefficient formula. The application of the centered cosine is referred to as Pearson Correlation in various resources or libraries on recommenders.How to Determine Ratings?You must compute the rating R that a user U would assign to a certain item I after identifying a list of users who are similar to user U. You can accomplish this in various ways, just like with similarity. You can anticipate that a user's rating R for a particular item will be fairly close to the average of the ratings I received from the top 5 or top 10 users who are most comparable to the user giving the rating U. The following is the mathematical formula for the average rating provided by n users: 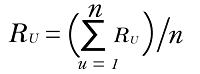
Explanation of the above equation:
The weighted average can be determined using the resemblance factor S for each user that is similar to the target user U using the given equations: 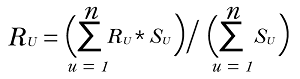
Explanation of the above equation:
User-Based vs. Item-Based Collaborative FilteringUser-based or consumer collaborative filtering is the method used in the examples above. It uses the rating matrix to identify users who are similar to one another based on the scores they provide. The method is known as item-based or shared Filtering if you utilize the rating matrix to locate comparable objects based on the ratings provided to them by users. Although the two methods are distinct concepts, they are technically extremely similar. Here is a comparison between the two:
Model-BasedThe huge yet sparse user-item matrix is reduced or compressed as part of the model-based techniques, which fall under the second group. A fundamental understanding of data pre-processing can be very beneficial for comprehending this phase. Diminished Dimensions Two dimensions exist in the user-item matrix:
Reducing the number of dimensions can enhance the algorithm's performance in terms of both space and time if the matrix is largely empty. Various techniques, including matrix factorization and autoencoders, can be used to do this. A huge matrix can be divided into smaller ones by matrix factorization. This is comparable to integer factorization, where Twelve can be expressed as either 4 x 3 or 6 x 2. A matrix A with elements m x n can be broken down into two matrices, X and Y, with values m x p and p x n, respectively, in the case of matrices. The users and things are represented as separate entities in the reduced matrices. In the first matrix, the m rows stand in for the m users, while the p columns provide information on the attributes or traits of the users. The item matrices with n samples and p attributes are the same. For Example: Amazon created item-based collaborative Filtering. Item-based Filtering is quicker and more reliable than user-based Filtering in systems with more items than users. It works because the average rating an item receives typically stays the same even as the average rating a user gives other goods. When the rating matrix is sparse, it is also known to do better than the user-based approach. However, the item-based technique could do better for datasets featuring browsing or entertainment-related items, like MovieLens, where the target consumers perceive the recommendations as highly obvious. Such datasets perform better when employing content-based filtering or hybrid recommenders that consider the data's content, such as the data's genre, as you will see in the next section. When Should You Use Collaborative Filtering?The interactions people have with items are taken into account during collaborative filtering. In contrast to what the data on the objects or users themselves can show, these interactions can reveal patterns. You can use the following criteria to determine whether collaborative filtering is appropriate:
Although recommenders frequently employ collaborative filtering, there are a number of difficulties that can arise when doing so.
ConclusionYou now understand how a collaborative-filtering type recommender is calculated, as well as how to quickly test out different types of algorithms on your dataset to see whether collaborative filtering is the best course of action. Even if it doesn't appear to fit your data accurately, some of the application cases mentioned may still be able to assist you in making long-term hybrid plans. Here are some links on information retrieval and various recommendation algorithms for additional reading and implementations. |
 For Videos Join Our Youtube Channel: Join Now
Feedback
- Send your Feedback to [email protected]
Help Others, Please Share


