| |
Python Tutorial
Python OOPs
Python MySQL
Python MongoDB
Python SQLite
Python Questions
Plotly
Python Tkinter (GUI)
Python Web Blocker
Python MCQ
Related Tutorials
Python Programs

Visualizing Geospatial Data using Folium in PythonIntroductionUrban planning and environmental tracking benefit greatly from using geospatial data, which is information about locations on the surface of the Earth. The Folium module is one of Python's greatest geographic data manipulation and visualization tools. A Python module called Folium makes it easier to make interactive maps to visualize geospatial data. You may make interactive maps using Folium that let users examine data points, polygons, and other geographical components. Folium provides an approachable and user-friendly way to convey location-based information, whether you're examining geographic trends. In this tutorial, we'll look at the basics of using Folium to visualize geospatial data. You'll discover how to build a base map, add markers and popups, change the appearance of map elements, and even overlay data layers. The capacity to effectively communicate geospatial findings can be improved by becoming a master of Folium, regardless of your role as a data analyst, investigator, or developer. All you need to get started is Python and the Folium package. After installing Folium, you can produce beautiful interactive maps that turn unprocessed geospatial data into insightful visualizations. Code Output 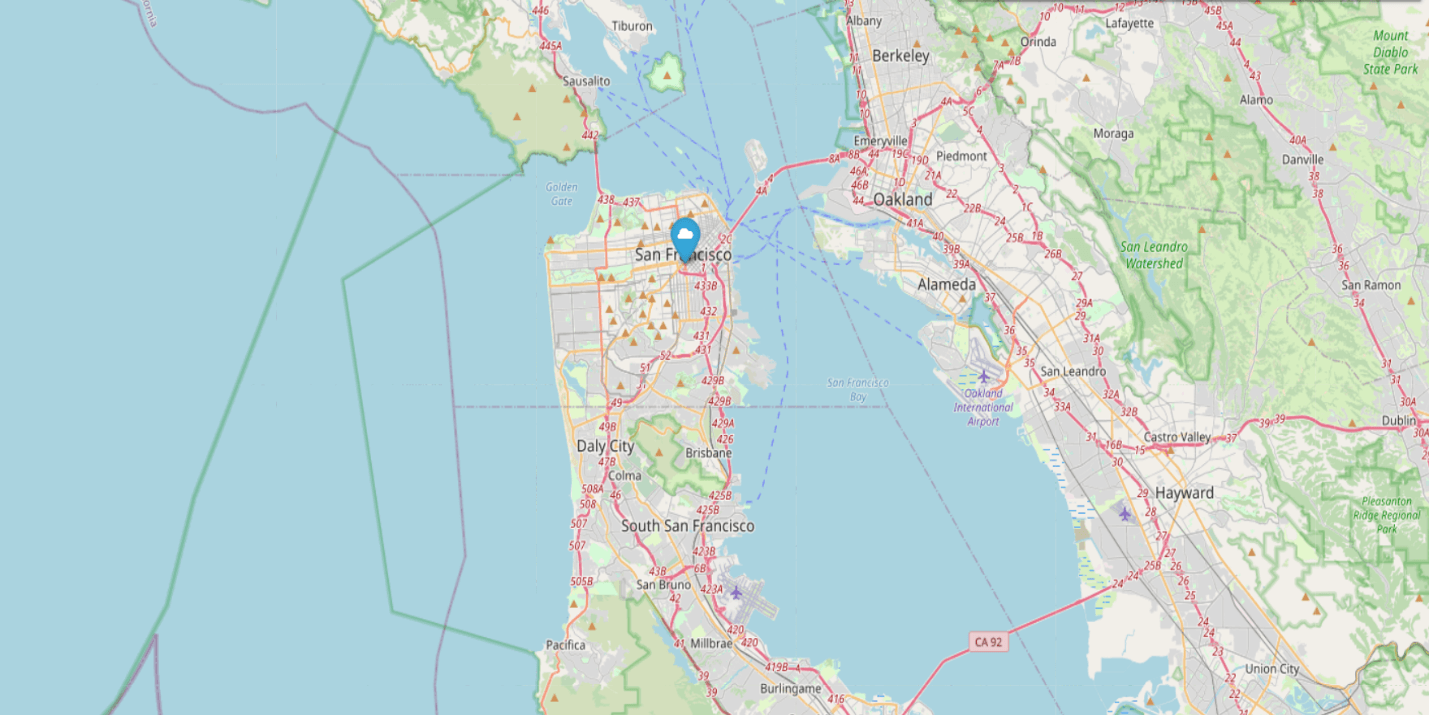
A free Python package called Folium makes it easier to create interactive maps with little to no scripting. Folium, which is based on the Leaflet.js JavaScript framework, enables users to create maps that are both visually appealing and useful. Its major feature is the ability to seamlessly include maps into Jupyter Notebooks, web apps, and data science workflows. Folium provides various customization options to adjust your maps to meet your needs. You can modify the map's centre, zoom level, and tilesets to fit your data. Additionally, you can modify markers, icons, and popups to communicate information efficiently. Another characteristic of Folium is its interactivity. Users can click on markers to show popup information, zoom in or out, and zoom in or out. This interactivity is essential for dynamically and captivatingly displaying geographical insights. ApplicationsReal Estate Analysis Folium may be utilized to display real estate data, such as neighbourhood details, property pricing, and listing information. Homebuyers and real estate experts can use maps to understand property locations and market patterns better. Property data may be displayed when users click on map markers on interactive maps. Tourism and Travel Planning Travel firms and tourism websites frequently use Folium to produce interactive maps highlighting tourist attractions, lodging options, dining options, and other areas of interest in different regions. Tourists can explore these maps to help them plan their excursions and find nearby attractions. Supply chain management and logistics Folium can be used by supply chain management and logistics businesses to view shipment routes, distribution hubs, and delivery status in real time. This promotes effective decision-making and aids in delivery route optimization. Health Promotion and Epidemiology Folium can help visualize public health statistics, such as the prevalence of diseases, vaccination rates, and the locations of medical services. Interactive maps during disease outbreaks can give medical experts and the general public useful information. Urban design and intelligent cities Folium is a tool that city planners can use to visualize transit networks, infrastructure upgrades, and urban development projects. With interactive maps, city authorities and residents can better comprehend the suggested modifications and their potential effects on the city. Education Folium can be a useful resource for teachers of geography, environmental science, and associated subjects. Teachers can construct interactive maps for instructional purposes that let students engage with datasets and geographic concepts. ConclusionIn geographic data visualization, Folium is a strong and adaptable tool that provides an accessible and user-friendly way to maximize the potential of geographic insights. With the help of this Python library, experts, academics, and enthusiasts from various industries can creatively and easily tap into the vast universe of geospatial data. Folium effortlessly blends interactive maps into data-driven narratives, helping everyone from urban planners to real estate agents to deliver property insights. Its adaptability enables customized visualizations that effectively engage users, whether for presenting real-time environmental data, streamlining supply chain management, or assisting vacationers in making travel plans. Folium's applications also cover healthcare, agriculture, and other fields, giving users the freedom to share knowledge and make educated decisions. Our capacity to comprehend and act upon geographical information is improved by its capability to turn complicated data sets into interactive, digestible maps. Folium is positioned to play a bigger part in facilitating the sharing and analysis of geospatial data as technology develops and data becomes more spatially relevant. Folium helps us navigate the world of location-based insights and plot a route for more intelligent decision-making and interesting data storytelling.
Next TopicRecaman's Sequence using Python
|
 For Videos Join Our Youtube Channel: Join Now
Feedback
- Send your Feedback to [email protected]
Help Others, Please Share


