| |
Python Tutorial
Python OOPs
Python MySQL
Python MongoDB
Python SQLite
Python Questions
Plotly
Python Tkinter (GUI)
Python Web Blocker
Python MCQ
Related Tutorials
Python Programs

Statistic with PythonIn this tutorial, we will learn statistics and its component using the Python, solving statistic problems and also explore the concept behind it. Statistics is a key concept that every data science enthusiast should have the good understanding of it. Python provides some statistic libraries that are comprehensive, widely used, and powerful. These libraries help us to smooth working with the data Statistic is a way of collection of the data, tabulation, and interpolation of numeric data. It allows us to describe, summarize, and represent of data visually. Statistic is a field of applied mathematics concern with interpolation, visual representation of data, and data collection analysis. There are two types of statistic - Descriptive statistic and inferential statistic. We will cover descriptive statistic in this tutorial. Some Python Statistics LibrariesPython provides many libraries that can be used in statistic but we will describe some most important and widely used libraries.
Measure of Central TendencyThe measure of central tendency represents the single value that attempts to define the whole set of data. It consists of three main central tendencies.
How to Calculate MeanMean represents the sum of the observations divided by the total number of observation. We can also refer as average which is sum divided by count. Python's statistic library provides the mode() method that returns the mean, it raises StatisticError, if the passed argument is empty. Let's understand the following example - Example - 1 Output: The mean value is : 2.5 Explanation - In the above code, we have imported the statistic module and initialized the list that contains observation values. We passed the list into the mean() method that returned an average of list values. We can also calculate the mean using the built-in sum() which takes the iterable of numeric values and gives their total sum. The len() method returns length of an object of iterable (string, list, tuple, byte, dictionary, set or range). Example - 2 Output: The mean is: 4.7 How to Calculate MedianMedian represents the middle value of the dataset which splits the data into the two halves. Median is calculated by calculating the average of two central elements in case of even dataset otherwise the central element would be odd. For odd Numbers - N+1/2 For Even Numbers - n/2, n/2+1 The statistics library provides the median() method to calculate the median, or middle element of data. It raises StatisticError, if the passed argument is empty. Let's understand the following example. Example - Output: Median of data-set 1 is 5 Median of data-set 2 is 5.6 Median of data-set 3 is 23/15 Median of data-set 4 is 0.0 How to Calculate Median LowThe median_low() method is used to get the median of data if the data set is odd. If the data set is even, it returns the lower of two middle elements. It raises StatisticError, if the passed argument is empty. Let's understand the following example. Example - Output: Median of the set is 3.5 Low Median of the even data set is 3 Low Median of the odd data set is 4 How to Calculate Median HighThe median_high() method is used to get the median of data if the data set is odd. If the data set is even, it returns the lower of two middle elements. It raises StatisticError, if the passed argument is empty. Let's understand the following example. Example - Output: Median of the set is 3.5 Low Median of the even data set is 4 Low Median of the odd data set is 4 Measure of VariabilityWe have learned about the measure of the central tendency but it is not to describe the data. We also need to know about the measure of variability. Measure of variability states how well our data is distributed. Below is the most common variability measure.
How to Calculate RangeThe range is known as the difference between the largest and smallest data point. The range is bigger more the spread of data or vice versa. range = Largest data value - smallest data value Let's understand the following example - Example - Output: Maximum is = 50, Minimum is = 10 and Range is = 40 Explanation - In the above code, we assigned a list with some data and calculated max using built-in max() method and min using the min() method. How to Calculate VarianceThe variance is a statistical measure of the spread between numbers in a data set. To calculate the variance, we use the following formula. 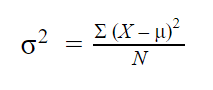
Where -
Python's statistics module provides the varience() method. Let's understand the following example. Example - Output: Variance of data1 is: 11.238095238095237 Variance of data2 is: 10.666666666666666 Variance of data3 is: 69.64285714285714 Variance of data4 is: 1277/36000 How to Calculate Standard DeviationIt is a square root of the variance. To calculate the standard deviation, we can use the following example. Where -
Python's statistics module provides the stdev() method. Let's understand the following example. Example - Output: Standard Deviation of data1 is: 3.352326839390103 Standard Deviation of data2 is: 3.265986323710904 Standard Deviation of data3 is: 8.345229603962801 Standard Deviation of data4 is: 0.18834070782022197 The multimode() MethodThis method returns the most frequently occurring values. It returns the values in the order of first occurrence in the data. It may return multiple results if there are multiple modes. Let's understand the following example. Example - Output: ['d'] Now we will cover some important statistics topics for data science that will help us to understand this topic in most precisely. Python Statistics & Probability TheorySo far we have discussed how to perform the basic operations using the statistics library and Python. Probability theory is a highly valuable to learning statistics with python. It's analysis of random phenomena means any random event can produce the non-predictive. There can be any of the various possible outcomes and the eventual outcome is resolute by chance. Probability theory consists of the conceptual origins of statistics. Statistical Modeling and Fitting in PythonStatistical models represent what produces our data and how can be used in data analysis. It helps us to summarize data, to simulate, and to predict the data. In the other words, we can used the generate data and used for summaries, predictions or simulations. However, it is essential that you should also be able to ascertain whether your data fits that model. Data estimation is a suitable way to provide the best fit between the model and the estimation. ConclusionThis tutorial is included how we can learn statistics using the Python programing language. We have covered the basic operations including types of statistics, how to find mean, median, and mode using the statistics library. We have also explored the measure of the central tendency including how to calculate standard deviation, variance, and range. This tutorial gives the idea about the descriptive statistics using Python. |
 For Videos Join Our Youtube Channel: Join Now
Feedback
- Send your Feedback to [email protected]
Help Others, Please Share


