| |

Python pympler libraryProgramming language like Python consists of different sets of libraries to perform memory profiling. Examples of such libraries can be memory_profiler, guppy/heapy, scalene, etc. All these libraries offer usage of memory through the python code in several ways. However, there is no provision of monitoring memory utilization of objects created with the help of user-defined classes in any of them. There are situations where we require monitoring the usage of memory by a specific kind of object. A Python library known as pympler can be very useful for those requirements. The pympler library consists of a list of modules that allows us to monitor the memory utilization by scripting in Python in different ways. In the following tutorial, we will understand different modules available in the pympler library with the help of various examples. So, let's get started. Understanding the Python pympler libraryThe pympler library is a development tool used to measure, monitor, and analyze the behaviour of the memory of the Python objects in a running Python-based application. We can obtain a detailed insight into the size and lifetime of Python objects by pympling a Python application. We can also easily identify undesirable or unexpected runtime behaviour such as memory bloat and other "pymples". Pympler integrates three previously separate modules into a single, comprehensive profiling utility. The asizeof module offers fundamental size detail for one or several Python objects. The muppy module is utilized for the online monitoring of a Python application. The ClassTracker class overs off-line analysis of the lifetime of selected Python objects. A web profiling frontend exposes process statistics, garbage visualization and class tracker statistics. Requirements for the pympler libraryThe pympler library is completely written in Python, with no dependencies on external libraries. This library integrates Bottle and Flot. The Pympler library has been tested with Python 3.5, 3.6, 3.7, 3.8, 3.9, and 3.10. Pympler is a platform-independent library tested on different Linux distributions (32-bits and 64-bits), Windows 7 and MacOS X. How to Install the Python pympler library?In order to install the Python library, we need 'pip', a framework to manage packages required to install the modules from the trusted public repositories. Once we have 'pip', we can install the pympler library using the command from a Windows command prompt (CMD) or terminal as shown below: Syntax: Verifying the InstallationOnce the module is installed, we can verify it by creating an empty Python program file and writing an import statement as follows: File: verify.py Now, save the above file and execute it using the following command in a terminal: Syntax: If the above Python program file does not return any error, the library is installed properly. However, in the case where an exception is raised, try reinstalling the library, and it is also recommended to refer to the official documentation of the pympler library. In the following tutorial, we will cover a list of modules shown below:
Let us understand these modules of the pympler library in detail. Understanding the asizeof moduleThe asizeof module allows us to measure the size of objects with the different methods it provides. Some of these methods are described in the following table:
Let us consider some examples demonstrating the usage of the above methods of the asizeof module. Example 1:Output: Size of the List list1: 880 bytes Size of the List list2: 48 bytes Size of the List list1, list2 combined: 928 bytes Size of the List list1 & list2: 880 bytes, 48 bytes Explanation: In the above snippet of code, we have imported the asizeof module from the pympler library. We have then defined two different lists. We have then used the asizeof() and asizesof() methods to calculate the size of different lists and print the results for the users. Example 2:Output: Object Type: Explanation: In the above snippet of code, we have again imported the required module and defined two different lists. We have then defined an object that stores the list generated from the asized() function. We have then printed the type of the object along with the object. We have then used the flat and size attributes to return the flat size and total size of the object. We have then again used the asized() method to include both lists. We have then printed the format of both lists. At last, we have printed the object stats and details. Example 3:Output: Size of Single element in a List : 8 bytes Basic Size of Object : 72 bytes Flat Size of Object : 248 bytes List of Objects Referred by an Object : [0, 1, 2, 3, 4, 5, 6, 7, 8, 9, 10, 11, 12, 13, 14, 15, 16, 17, 18, 19] Explanation: In the above snippet of code, we have used the methods like itemsize(), basicsize(), flatsize() and refs() to print different details with respect to the list we defined. Example 4:Output: Is Object Class : False Is Object Built-in : False Is Object Code : False Is Object Frame : False Is Object Function : False Is Object method : False Is Object Module : False Is Object Module : True Is Object Function : False Is Object method : True Is Object Function : True Is Object method : False Is Object Class : True Is Object Built-in : True Is Object Built-in : True Is Object Built-in : True Explanation: We have imported the required modules and defined the list in the above snippet of code. We have then used the different methods like isclass(), isbuiltin(), iscode(), isframe(), isfunction(), ismethod() and ismodule() to print different Boolean outputs. Understanding the classtracker and classtracker_stats moduleThe classtracker module allows us to monitor the memory utilization of objects created by user-defined classes with different methods. The classtracker_stats module allows us to format data capture with the help of the classtracker module in various ways. In the following section, we will understand with the help of different examples how we can trace memory utilization by specific kinds of user-defined objects and then format stats of monitoring in several ways using the classtracker and classtracker_stats modules. There are various classes and methods that these modules offer. Some of them are described below:
Let us now consider some examples demonstrating the use of the above classes and methods of the classtracker module. Example 1:Output: ---- SUMMARY ------------------------------------------------------------------ Start active 0 B average pct RandomNumberGenerator 0 64 B 0 B 0% Intermediate active 0 B average pct RandomNumberGenerator 2 25.75 MB 12.88 MB 0% End active 0 B average pct RandomNumberGenerator 2 17.17 MB 8.58 MB 0% ------------------------------------------------------------------------------- Explanation: In the above snippet of code, we have imported the required modules. We have then defined a class to generate random numbers. We created an object of the ClassTracker() class and used the track_class() method to track the created class. We have then used the create_snapshot() method to record the memory usage by the registered class. We created multiple objects of the class and again used the create_snapshot() method. We deleted an object of the class and again used the create_snapshot() method. At last, we have printed the summary using the stats.print_summary() method and closed the processing using the close() method. Example 2:Output: ---- SUMMARY ------------------------------------------------------------------ Start active 0 B average pct RandDistribution 0 0 B 0 B 0% RandomNumberGenerator 0 64 B 0 B 0% Intermediate active 0 B average pct RandDistribution 2 156.84 KB 78.42 KB 0% RandomNumberGenerator 2 7.63 MB 3.81 MB 0% End active 0 B average pct RandDistribution 1 78.45 KB 78.45 KB 0% RandomNumberGenerator 1 3.82 MB 3.82 MB 0% ------------------------------------------------------------------------------- ---- SUMMARY ------------------------------------------------------------------ ------------------------------------------------------------------------------- Explanation: In the above snippet of code, we have again imported the required modules and created two different classes. We created an object of the ClassTracker() class and used the track_class() method for both classes. We have then used the create_snapshot() method multiple times to record the memory usage by both classes. We have also performed different functions like instantiating the class deleting an object. We have then printed the summary. We have used the clear() method to clear the stats collected. At last, we have printed the summary again and closed the process. Example 3:Output: ---- SUMMARY ------------------------------------------------------------------ Start active 0 B average pct RandDistribution 0 352.16 KB 0 B 0% RandomNumberGenerator 0 88.22 KB 0 B 0% Intermediate active 0 B average pct RandDistribution 0 352.16 KB 0 B 0% RandomNumberGenerator 0 88.22 KB 0 B 0% End active 0 B average pct RandDistribution 0 352.16 KB 0 B 0% RandomNumberGenerator 0 88.22 KB 0 B 0% ------------------------------------------------------------------------------- Explanation: In the above snippet of code, we have seen the use of the methods like track_object() and track_change() in order to monitor the memory usage by the object, passed to it and changes to it. Example 4:Output: ---- SUMMARY ------------------------------------------------------------------ Start active 0 B average pct RandDistribution 0 0 B 0 B 0% RandomNumberGenerator 0 64 B 0 B 0% Intermediate active 0 B average pct RandDistribution 0 176.11 KB 0 B 0% RandomNumberGenerator 1 8.58 MB 8.58 MB 0% End active 0 B average pct RandDistribution 0 176.11 KB 0 B 0% RandomNumberGenerator 1 8.58 MB 8.58 MB 0% ------------------------------------------------------------------------------- ---- SUMMARY ------------------------------------------------------------------ Start active 0 B average pct RandDistribution 0 0 B 0 B 0% RandomNumberGenerator 0 64 B 0 B 0% Intermediate active 0 B average pct RandDistribution 0 176.11 KB 0 B 0% RandomNumberGenerator 1 8.58 MB 8.58 MB 0% End active 0 B average pct RandDistribution 0 176.11 KB 0 B 0% RandomNumberGenerator 1 8.58 MB 8.58 MB 0% Last active 0 B average pct RandDistribution 1 176.11 KB 176.11 KB 0% RandomNumberGenerator 0 16 B 0 B 0% ------------------------------------------------------------------------------- Tracked Classes : ['RandDistribution', 'RandomNumberGenerator'] Explanation: In the above snippet of code, we have illustrated the method of removing a class that we do not want to monitor and the way of dumping monitoring stats to an output file that we can load later. For this example, we have used the detach_class(), stats.sort_stats(), and stats.dump_stats() methods. First of all, we have registered two classes we created earlier for monitoring, then created the instances of classes, deleted a few instances, and then unregistered one class from monitoring. We have also taken a memory snapshot between steps. We have then checked if it is still monitoring a new object of that class getting created. At last, we have stored the monitoring stats in an output file. The classtracker module also offers a ConsoleStats class which allows us to load monitoring stats from a file. Below we have reloaded again monitoring stats store to a file in a previous step and printed stats again to verify. Example 5:Output: ---- SUMMARY ------------------------------------------------------------------ Start active 0 B average pct RandDistribution 0 0 B 0 B 0% RandomNumberGenerator 0 64 B 0 B 0% Intermediate active 0 B average pct RandDistribution 0 176.11 KB 0 B 0% RandomNumberGenerator 1 8.58 MB 8.58 MB 0% End active 0 B average pct RandDistribution 0 176.11 KB 0 B 0% RandomNumberGenerator 1 8.58 MB 8.58 MB 0% Last active 0 B average pct RandDistribution 1 176.11 KB 176.11 KB 0% RandomNumberGenerator 0 16 B 0 B 0% ------------------------------------------------------------------------------- Tracked Classes : ['RandDistribution', 'RandomNumberGenerator'] Explanation: In the above snippet of code, we have used the ConsoleStats() class and printed the summary. Example 6:Output: ---- SUMMARY ------------------------------------------------------------------ Start active 0 B average pct RandDistribution 0 0 B 0 B 0% RandomNumberGenerator 0 64 B 0 B 0% Intermediate active 0 B average pct RandDistribution 2 352.16 KB 176.08 KB 0% RandomNumberGenerator 2 17.17 MB 8.58 MB 0% End active 0 B average pct RandDistribution 1 176.11 KB 176.11 KB 0% RandomNumberGenerator 1 8.58 MB 8.58 MB 0% ------------------------------------------------------------------------------- Tracked Classes : ['RandDistribution', 'RandomNumberGenerator'] HTML Output: 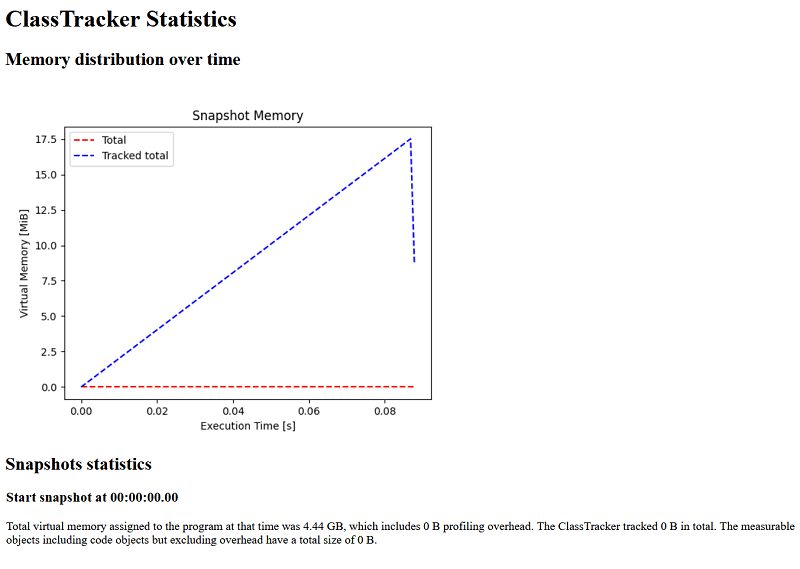
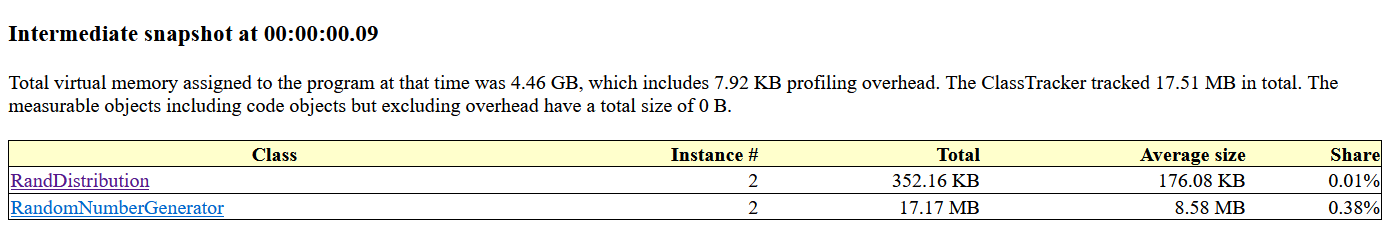
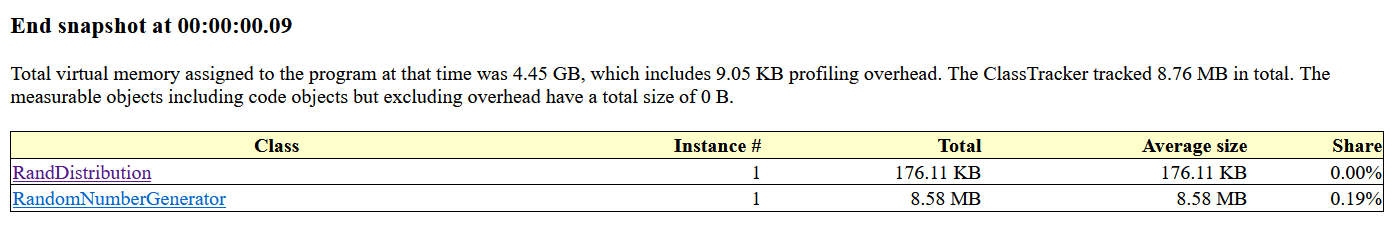
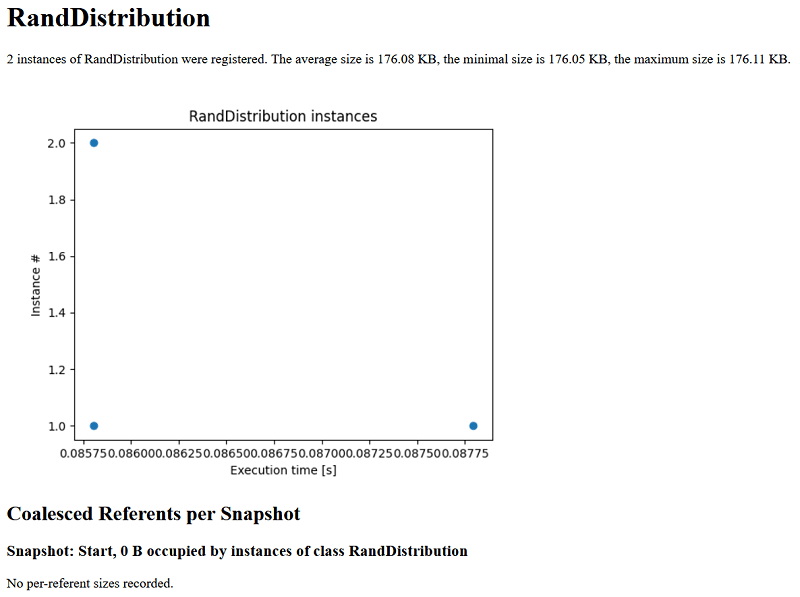
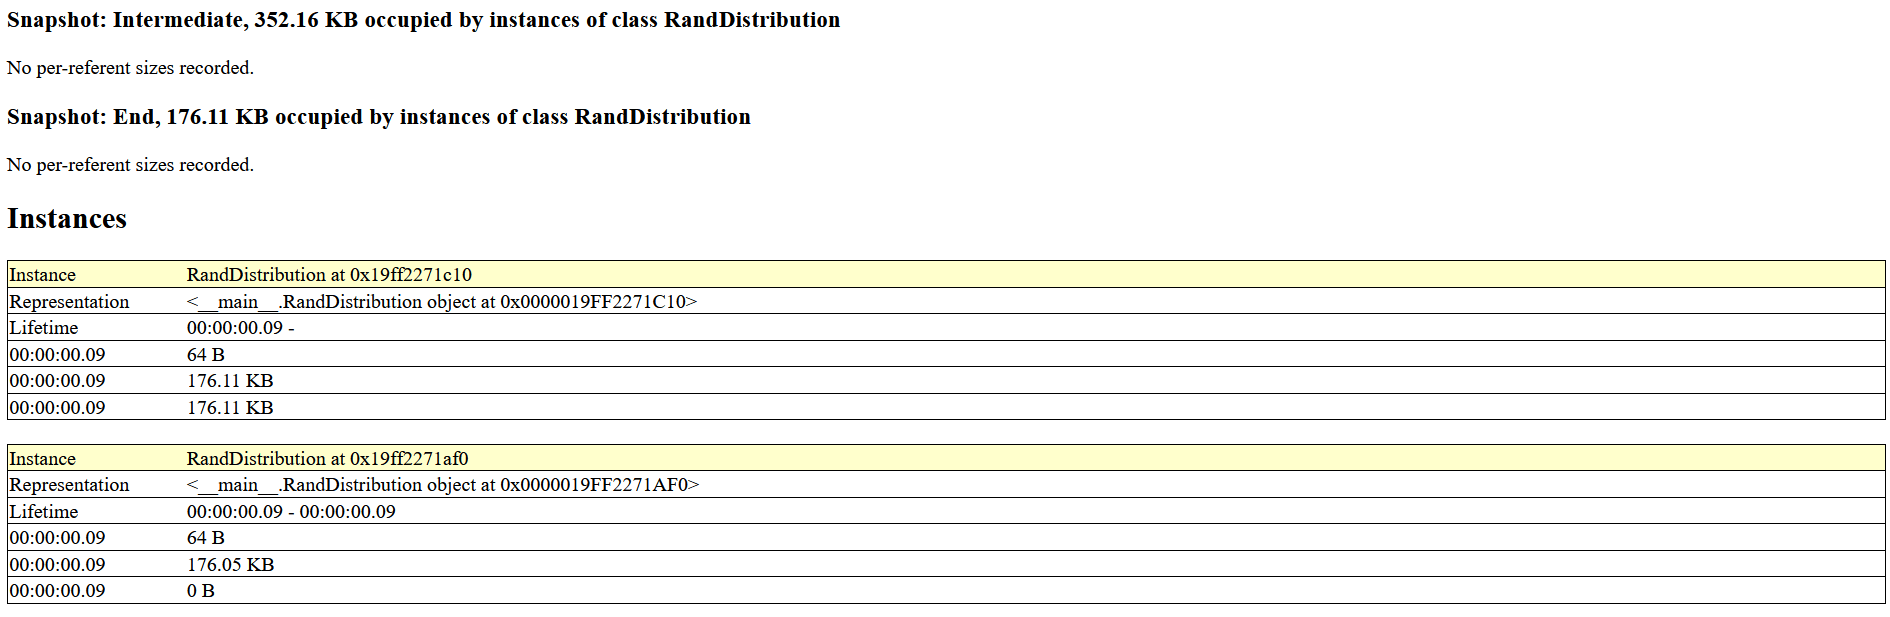
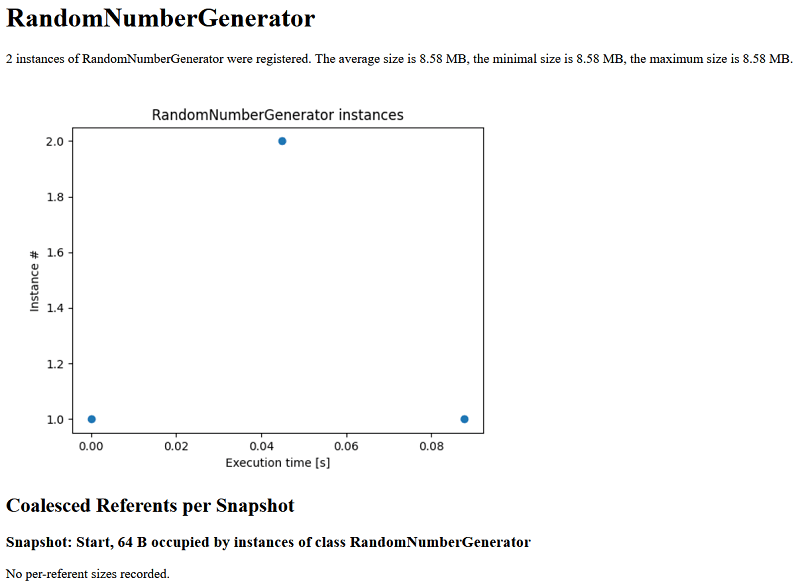
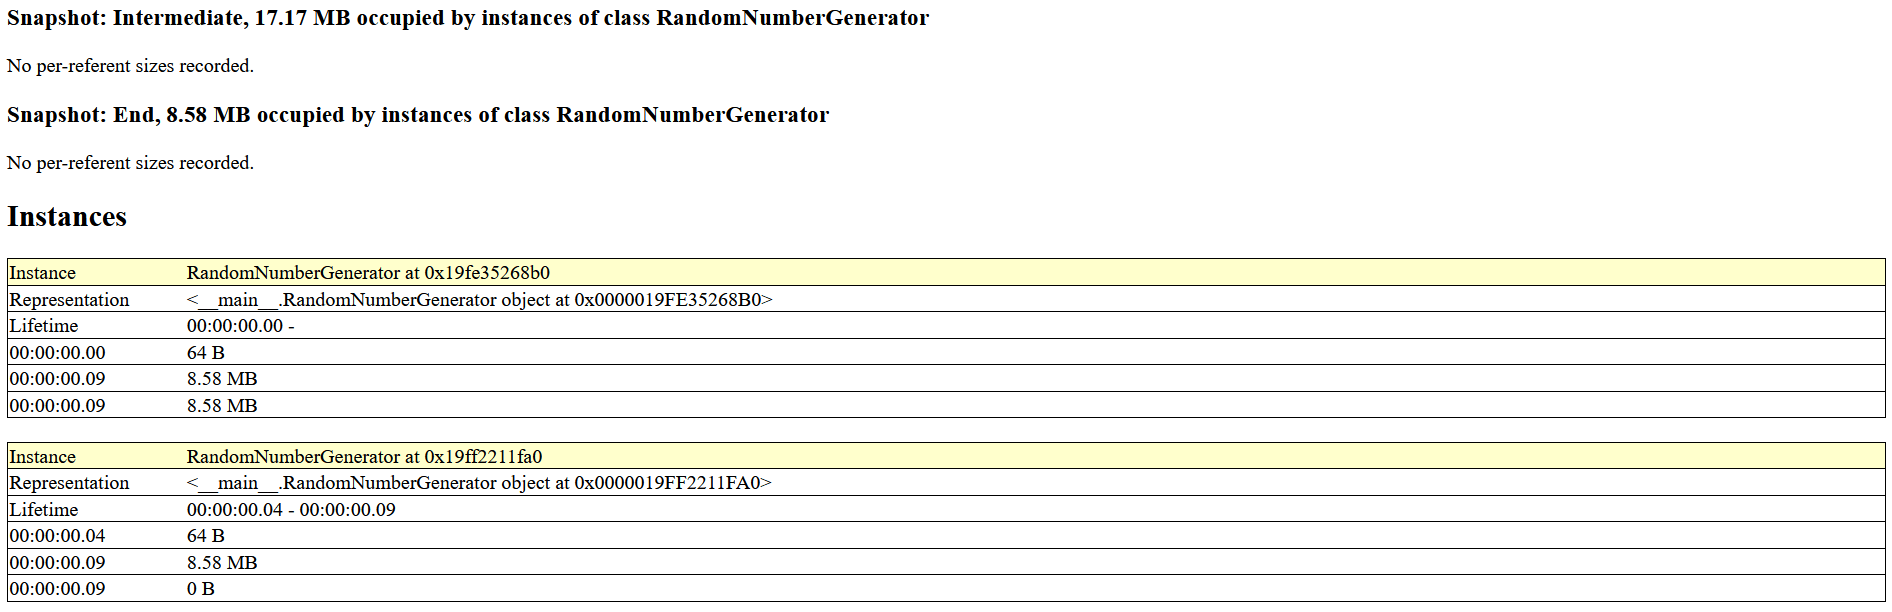
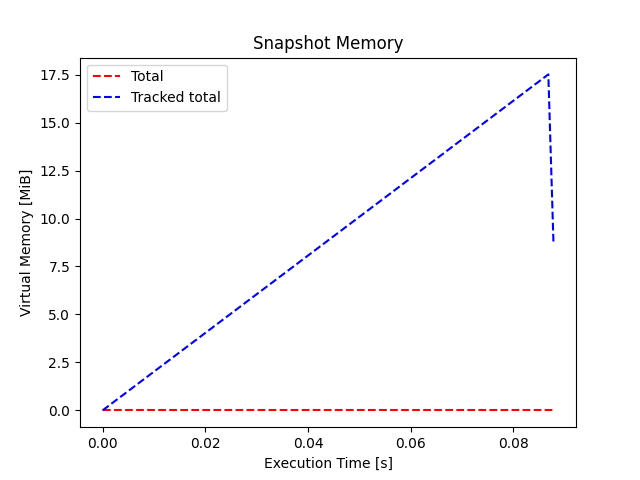
Explanation: In the above snippet of code, we have explained the method of formatting the monitoring statistics as an HTML file with charts explaining a class's memory usage using the HtmlStats() class. We have then used the create_html() method to create the HTML file. Example 7:Output:
---- SUMMARY ------------------------------------------------------------------
                                         active      0     B      average   pct
  RandDistribution                            0      0     B      0     B    0%
  RandomNumberGenerator                       0     64     B      0     B    0%
-------------------------------------------------------------------------------
---- SUMMARY ------------------------------------------------------------------
                                         active      0     B      average   pct
  RandDistribution                            0      0     B      0     B    0%
  RandomNumberGenerator                       0     64     B      0     B    0%
                                         active      0     B      average   pct
  RandDistribution                            2    352.16 KB    176.08 KB    0%
  RandomNumberGenerator                       2     17.17 MB      8.58 MB    0%
-------------------------------------------------------------------------------
Explanation: In the above snippet of code, we have explained the method to inform the class tracker to take snapshots periodically rather than manually taking snapshots each time using the PeriodicThread() class. In the above example, we have shown the use of the tracker.stop_periodic_snapshots() and tracker.start_periodic_snapshots() methods. Understanding the tracker moduleThe tracker module allows us to monitor overall memory usage over time. It can allow us to track the difference in memory usage between summaries. We will start by importing the tracker module from the pympler library: Syntax: These are the following classes and methods that the tracker module offers:
Let us consider some examples demonstrating the usage of the above methods. Example 1:Output:
                                    types |   # objects |   total size
========================================= | =========== | ============
                                     list |        3871 |    334.62 KB
                                      str |        3875 |    270.01 KB
                                      int |         881 |     24.10 KB
                                     dict |           7 |      1.48 KB
                                     code |           1 |      1.22 KB
                                    tuple |          12 |    672     B
                   pympler.asizeof.Asized |           8 |    512     B
                    function (store_info) |           1 |    136     B
  pympler.process._ProcessMemoryInfoWin32 |           2 |     96     B
            pympler.classtracker.Snapshot |           2 |     96     B
                                     cell |           2 |     80     B
                                  weakref |           1 |     72     B
                                   method |           1 |     64     B
                                    float |           2 |     48     B
Explanation: In the above snippet of code, we have imported the required module. We have then created an instance of the SummaryTracker() class and print the difference between two summaries using the print_diff() method. Example 2:Output:
                                    types |   # objects |   total size
========================================= | =========== | ============
                                     list |        3870 |    453.31 KB
                                      int |       15858 |    433.62 KB
                                      str |        3874 |    269.93 KB
                                     dict |           4 |    576     B
                   pympler.asizeof.Asized |           8 |    512     B
                                    tuple |           8 |    448     B
                                     code |           0 |    179     B
  pympler.process._ProcessMemoryInfoWin32 |           2 |     96     B
            pympler.classtracker.Snapshot |           2 |     96     B
                                    float |           2 |     48     B
Explanation: In the above snippet of code, we have imported the required module. We have then created an instance of the SummaryTracker() class and created two different summaries using the create_summary() method. We have then used the print_diff() method to print the difference between both the summary of memory usage. Example 3:Output:
[
    ['list', 3870, 464192],
    ['int', 15856, 443976],
    ['str', 3874, 276407],
    ['dict', 4, 576],
    ['pympler.asizeof.Asized', 8, 512],
    ['tuple', 8, 448],
    ['code', 0, 413],
    ['pympler.process._ProcessMemoryInfoWin32', 2, 96],
    ['pympler.classtracker.Snapshot', 2, 96],
    ['float', 2, 48]
]
Explanation: In the above snippet of code, we have used the diff() method to return the difference between two summaries as a list and used the sorted() method to sort the list and printed for the users. Understanding the muppy moduleThe muppy module allows the developer to detect memory leaks. We will start by importing the muppy module from the pympler library: Syntax: Different methods that the muppy module provides are described as follows:
Let us consider the following examples illustrating the usage of the above methods of the muppy module: Example 1:Output: Number of Objects : 50880 Explanation: In the above snippet of code, we have imported the required module and used the get_objects() method to get a list of all objects in the memory and printed the total number of objects using the len() method. Example 2:Output:
[
    [],
    [(
        2294,
        140,
        'the_objects = muppy.get_objects()\nprint("Number of Objects : ", len(the_objects))',
        'the_objects = muppy.get_objects()\nprint("Number of Objects : ", len(the_objects))'
        )],
    [],
    [],
    []
]
Explanation: In the above snippet of code, we have used the filter() method to filter the objects in the list and printed the list for the users. Example 3:Output:
Number of Objects Referred by List the_list :  5999
                       types |   # objects |   total size
============================ | =========== | ============
                         str |       15902 |      3.10 MB
                        dict |        4296 |      1.67 MB
                        code |        5352 |    924.66 KB
                        type |         836 |    654.47 KB
                        list |         318 |    563.39 KB
                         int |        7640 |    213.69 KB
                         set |         146 |    213.30 KB
                       tuple |        3411 |    194.41 KB
          wrapper_descriptor |        2201 |    154.76 KB
           method_descriptor |        1239 |     87.12 KB
                 abc.ABCMeta |          87 |     85.15 KB
  builtin_function_or_method |        1210 |     85.08 KB
                     weakref |        1177 |     82.76 KB
           getset_descriptor |         849 |     53.06 KB
                   frozenset |         122 |     47.48 KB
Size of List theList : 121432 bytes
Explanation: In the above snippet of code, we have demonstrated the use of the get_referents(), print_summary(), and getsizeof() methods. Understanding the garbagegraph moduleThe garbagegraph module allows us to monitor cyclic objects. This module consists of a class named GarbageGraph, which accepts an input list of objects and generates graphviz visualization displaying the relation between them, which can support us detect a cycle. The GarbageGraph is an extension of ReferenceGraph, which we will be discussing in the refgraph section. We will start by importing the garbagegraph module from the pympler library: Syntax: The following are the methods that the garbagegraph module offers:
Let us now consider an example demonstrating the usage of the above methods of the garbagegraph module. Example:Output File: refGraph.out
// Process this file with graphviz
digraph G {
    node [shape=box];
    "Xx7f39954b7340" [ label = "'A'\nstr"  ];
    "Xx55ca999273e0" [ label = "True\nbool"  ];
    "Xx7f38d1955cf0" [ label = "{'A': True}\ndict"  ];
    "Xx7f38d0ab2508" [ label = "[10, 20, 30]\nlist"  ];
    "Xx7f38d1404b88" [ label = "{20 : 30}\ndict"  ];
    Xx7f38d1955cf0 -> Xx55ca999273e0 [label="A"];
}
Output: True Explanation: In the above snippet of code, we have shown the usage of the write_graph() and render() methods of the garbagegraph module. Understanding the refbrowser moduleThe refbrowser module allows us to print tree-like illustrations for object referrers. We will start by importing the refbrowser module from the pympler library: Syntax: Let us consider the following examples demonstrating the use of the ConsoleBrowser and FileBrowser classes of the refbrowser module. Example 1:Output:
Using the ConsoleBrowser Class:
str-+-list--dict--module(__main__)
    +-dict--module(__main__)--dict
    +-frozenset--dict-+-module(sre_parse)
    |                 +-function (_class_escape)
    |                 +-function (_escape)
    |                 +-function (_uniq)
    |                 +-function (_parse_sub)
    |                 +-function (_parse)
    |                 +-function (_parse_flags)
    |                 +-function (fix_flags)
    |                 +-function (parse)
    |                 +-function (parse_template)
    |                 +-function (expand_template)
    |                 +-function (__init__)
    |                 +-function (opengroup)
    |                 +-function (closegroup)
    |                 +-function (checkgroup)
    |                 +-function (checklookbehindgroup)
    |                 +-function (__init__)
    |                 +-function (dump)
    |                 +-function (__repr__)
    |                 +-function (__len__)
    |                 +-function (__delitem__)
    |                 +-function (__getitem__)
    |                 +-function (__setitem__)
    |                 +-function (insert)
    |                 +-function (append)
    |                 +-function (getwidth)
    |                 +-function (__init__)
    |                 +-function (__next)
    |                 +-function (match)
    |                 +-function (get)
    |                 +-function (getwhile)
    |                 +-function (getuntil)
    |                 +-function (tell)
    |                 +-function (seek)
    |                 +-function (error)
    |                 +-function (groups)
    |                 +-function (pos)
Explanation: From the above example, we can understand the creation of a tree-like exploration of objects with the help of the ConsoleBrowser class of the refbrowser module. Example 2: Output:
Using the FileBrowser Class:
str-+-frame (codename: _get_tree)-+-frame (codename: _get_tree)-+-frame (codename: _get_tree)
    |                             |                             +-list
    |                             |
    |                             +-frame (codename: _get_tree)-+-frame (codename: _get_tree)
    |                             |                             +-list
    |                             |
    |                             +-frame (codename: _get_tree)-+-frame (codename: _get_tree)
    |                             |                             +-list
    |                             |                             +-list
    |                             |
    |                             +-frame (codename: _get_tree)-+-frame (codename: _get_tree)
    |                             |                             +-list
    |                             |
    |                             +-frame (codename: _get_tree)-+-frame (codename: _get_tree)
    |                             |                             +-list
    |                             |
    |                             +-list
    |                             +-frame (codename: _get_tree)-+-list
    |                             |                             +-frame (codename: _get_tree)
    |                             |                             +-list
    |                             |
    |                             +-frame (codename: _get_tree)-+-list
    |                             |                             +-frame (codename: _get_tree)
    |                             |
    |                             +-frame (codename: _get_tree)-+-list
    |                             |                             +-frame (codename: _get_tree)
    |                             |
    |                             +-frame (codename: _get_tree)--list
    |
    +-list-+-list-+-list
    |      |      +-list
    |      |      +-list
    |      |      +-list
    |      |      +-list
    |      |      +-list
    |      |      +-frame (codename: _get_tree)
    |      |      +-list
    |      |      +-list
    |      |      +-list
    |      |      +-list
    |      |      +-list
    |      |      +-frame (codename: _get_tree)
    |      |
    |      +-frame (codename: _get_tree)-+-list
    |      |                             +-frame (codename: _get_tree)
    |      |                             +-list
    |      |
    |      +-dict-+-list
    |             +-list
    |             +-frame (codename: _get_tree)
    |             +-frame (codename: _get_tree)
    |             +-frame (codename: _get_tree)
    |             +-module(__main__)
Explanation: From the above example, we can understand the creation of a tree-like exploration of objects with the help of the FileBrowser class of the refbrowser module. Understanding the refgraph moduleThe refgraph module allows us to create a graphviz graph of references. We will start by importing the refgraph module from the pympler library: Syntax: The following are the methods that the refgraph module offers:
Let us now consider some examples demonstrating the usage of the above methods of the refgraph module. Example 1:Output:
// Process this file with graphviz
digraph G {
    node [shape=box];
    "Xx238d66c43f0" [ label = "'A'\nstr"  ];
    "Xx7ffb66896868" [ label = "True\nbool"  ];
    "Xx238d6665b40" [ label = "{'A': True}\ndict"  ];
    "Xx238e53935c0" [ label = "[10, 20, 30]\nlist"  ];
    "Xx238d6665c00" [ label = "{20: 30}\ndict"  ];
    Xx238d6665b40 -> Xx7ffb66896868 [label="A"];
}
Explanation: In the above snippet of code, we have imported the required module and defined some objects. We have then created an object of the ReferenceGraph() class that accepts a list of objects defined earlier. We have then used the write_graph() method to save the reference graph to an output file. Example 2:Output: True Explanation: In the above snippet of code, we have demonstrated the use of the render() method of the ReferenceGraph() class. Understanding the summary moduleThe summary module allows us to create a summary of the list of objects. We will start by importing the summary module from the pympler library: Syntax: The following are the methods that the summary module offers:
Let us now consider an example demonstrating the usage of the above methods of the summary module. Example 1:Output: types | # objects | total size ======= | =========== | ============ list | 345 | 79.32 KB Explanation: In the above snippet of code, we have imported the required module. We have then used the summarize() method to create a summary for a list of objects as a table. We have then used the print_() method to print the output of the summarize() method. Example 2:Output:
  types |   # objects |   total size
======= | =========== | ============
    int |        5999 |    164.03 KB
Explanation: In the above snippet of code, we have imported the required module. We have then used the summarize() method to create a summary for a list of objects as a table. We have then used the print_() method to print the output of the summarize() method. Example 3:Output:
                       types |   # objects |   total size
============================ | =========== | ============
                         str |       16673 |      3.21 MB
                        dict |        4544 |      1.77 MB
                        code |        5638 |    975.36 KB
                        type |         891 |    703.47 KB
                         set |         147 |    213.51 KB
                       tuple |        3615 |    205.41 KB
          wrapper_descriptor |        2294 |    161.30 KB
  builtin_function_or_method |        1486 |    104.48 KB
           method_descriptor |        1306 |     91.83 KB
                     weakref |        1242 |     87.33 KB
                 abc.ABCMeta |          87 |     85.15 KB
                        list |         342 |     79.16 KB
           getset_descriptor |         901 |     56.31 KB
                         int |        1814 |     54.70 KB
                   frozenset |         122 |     47.48 KB
Explanation: In the above snippet of code, we have imported the required module. We have then used the summarize() method to create a summary for a list of objects as a table. We have then used the print_() method to print the output of the summarize() method. Example 4:Output:
                       types |   # objects |   total size
============================ | =========== | ============
                         str |       16671 |      3.21 MB
                        dict |        4542 |      1.77 MB
                        code |        5638 |    975.36 KB
                        type |         891 |    703.47 KB
                         set |         147 |    213.51 KB
                       tuple |        3611 |    205.20 KB
          wrapper_descriptor |        2294 |    161.30 KB
  builtin_function_or_method |        1486 |    104.48 KB
           method_descriptor |        1306 |     91.83 KB
                     weakref |        1242 |     87.33 KB
                 abc.ABCMeta |          87 |     85.15 KB
           getset_descriptor |         901 |     56.31 KB
                         int |        1804 |     54.42 KB
                   frozenset |         122 |     47.48 KB
         function (__init__) |         253 |     33.60 KB
Explanation: In the above snippet of code, we have shown the use of the get_diff() method of the summary module.
Next TopicSnakeViz library in Python
|
 For Videos Join Our Youtube Channel: Join Now
Feedback
- Send your Feedback to [email protected]
Help Others, Please Share


