| |

Amazon Pi ToolAmazon PI (Performance Intelligence) is a tool developed by Amazon Web Services (AWS) to help customers monitor and optimize the performance of their applications on the AWS platform. With Amazon PI, users can easily identify performance bottlenecks, troubleshoot issues, and make informed decisions to improve the overall performance of their applications. Sellers may create a solid strategy to increase sales on the Amazon store while lowering ACOS with the aid of Amazon Pi insights, which allows them to make use of data for Amazon organic and Amazon advertisements. The tool provides a wide range of features to help users understand the performance of their applications, including real-time performance metrics, detailed performance reports, and performance history. Amazon PI also includes several visualization tools, such as charts and graphs, to help users better understand their data. One of the key features of Amazon PI is its ability to monitor the performance of multiple resources at once. This includes monitoring the performance of Amazon Elastic Compute Cloud (EC2) instances, Amazon Elastic Block Store (EBS) volumes, and Amazon Relational Database Service (RDS) instances. Additionally, Amazon PI can also monitor the performance of other AWS services, such as Amazon Simple Queue Service (SQS) and Amazon Simple Notification Service (SNS). Another important feature of Amazon PI is its ability to troubleshoot performance issues. The tool provides detailed performance reports that can help users identify the root cause of a problem, such as high CPU usage or slow disk I/O. Additionally, Amazon PI includes several diagnostic tools, such as tracing and profiling, to help users understand the behaviour of their applications. To further help users improve the performance of their applications, Amazon PI includes several optimization tools. For example, users can use the tool to identify underutilized resources and right-size their instances. Additionally, Amazon PI can also help users optimize their storage and database performance. One of the most powerful features of Amazon PI is its ability to provide real-time performance metrics. This allows users to quickly identify performance bottlenecks and take action to resolve them. Additionally, Amazon PI also provides alerts and notifications to notify users of potential issues. Overall, Amazon PI is an extremely powerful and versatile tool that can help users monitor and optimize the performance of their applications on the AWS platform. With its wide range of features and powerful visualization tools, Amazon PI makes it easy for users to understand and improve the performance of their applications. Real-time performance metrics, thorough performance reports, and performance histories are just a few of the many capabilities offered by the tool to assist users in understanding the performance of their applications. A variety of visualisation tools, including graphs and charts, are also included with Amazon PI to aid users in comprehending their data. It's important to note, Amazon PI can be used with other AWS services such as AWS Elastic Beanstalk, AWS Lambda and AWS App Runner, Amazon PI can be used to gain insights into the performance of these services and make informed decisions about how to optimize them for better performance. In conclusion, Amazon PI is a valuable tool for any organization that is looking to improve the performance of their applications on the AWS platform. With its real-time performance metrics, troubleshooting tools, and optimization features, Amazon PI can help users identify performance bottlenecks, troubleshoot issues, and make informed decisions to improve the overall performance of their applications. This tool can help organizations to ensure that their applications are running smoothly, and to make the most of their investment in AWS. Amazon PI is a tool that provides several types of reports to help you monitor and analyse your Amazon RDS or Aurora database performance. Some reports based on Amazon pi tool are followed as:
For instance, if the constant utilised is 10 and your product page received 5000 views, the number of views that were indexed will be 500. Amazon use this technique to make it easier to understand these reports so that you can see trends in product views rather than individual views. 0.. 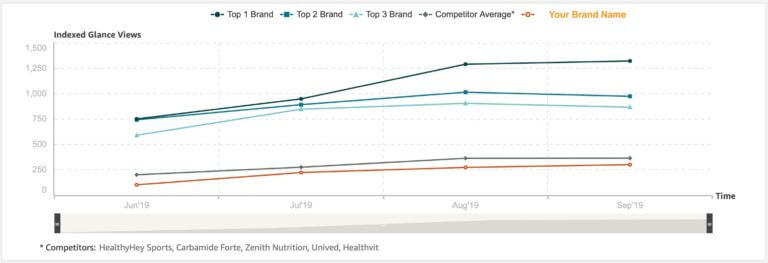
With the help of the screenshot below, you can see how three rival brands stack up against your own, giving you a better idea of how many people are viewing your product page compared to those of your competitors. When creating the report, Amazon employs a constant shared by the three rivals. Higher product views than rivals indicate that customers are evaluating your product, but this does not guarantee a sale. You can contrast this data with the sales report to learn more about the conversion rates from product page views to sales. If there are lots of product views but few sales, your product pages need to be successfully optimised considering the following factors: Product description: Providing a thorough description of the product along with the desired keywords. Including the product's USPs, reliability indicators, and reviews on the product page. Use discounts to increase sales by researching the pricing and discounting strategies of your competitors. The following factors should be considered if you are seeing low product views on the product pages. Promote those product categories with low product views. Utilize traffic from outside sources to boost the number of product views, for as by running advertisements on Facebook or Google for Amazon product pages. One may better understand how your products are selling on Amazon with the use of Amazon pi store analytics. By enhancing search coverage, search ranking, and learning from sales reports, a successful plan can be identified. To increase sales from an Amazon store, you should always compare company performance to that of the rivals and properly optimise marketing campaigns.
Next TopicAntennas and Wave propagation
|
 For Videos Join Our Youtube Channel: Join Now
Feedback
- Send your Feedback to [email protected]
Help Others, Please Share


