| |
Python Tutorial
Python OOPs
Python MySQL
Python MongoDB
Python SQLite
Python Questions
Plotly
Python Tkinter (GUI)
Python Web Blocker
Python MCQ
Related Tutorials
Python Programs

How to Plot Multiple Plots using Bokeh in PythonBokeh is a Python library which is used for data visualization. It creates its plots using HTML and JavaScript languages, and it also targets modern website browsers to provide presentation elegant, concise construction of novel graphics good high-performance interactivity. In this tutorial, we will learn how to plot multiple plots by using the Bokeh library in Python. We will be using the row() function of the bokeh.layouts module can be used in the show() function of bokeh.io library to illustrate multiple plots by using the bokeh library. Syntax:The syntax for show() function is: In which fig1, fig2, fig3, and so on are objects of the class figure in bokeh.plotting module. Approach:For plotting multiple plots on a graph by using the bokeh module, we will use the following approach:
Example 1: To Plot Different Plots in the Same PageOutput: 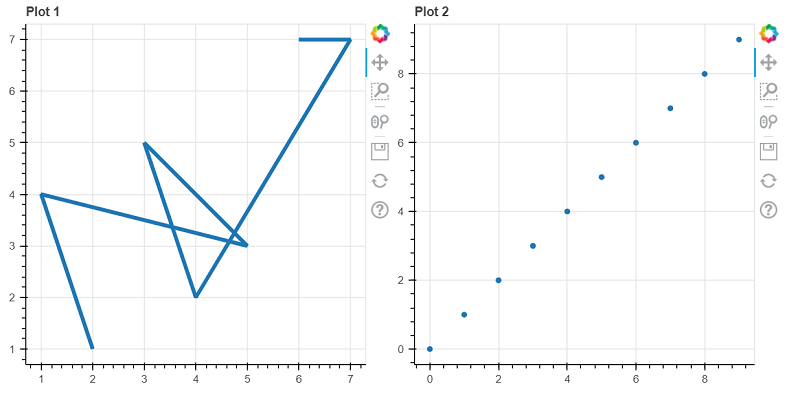
Example 2: To Plot Different Plots in Same FrameOutput: 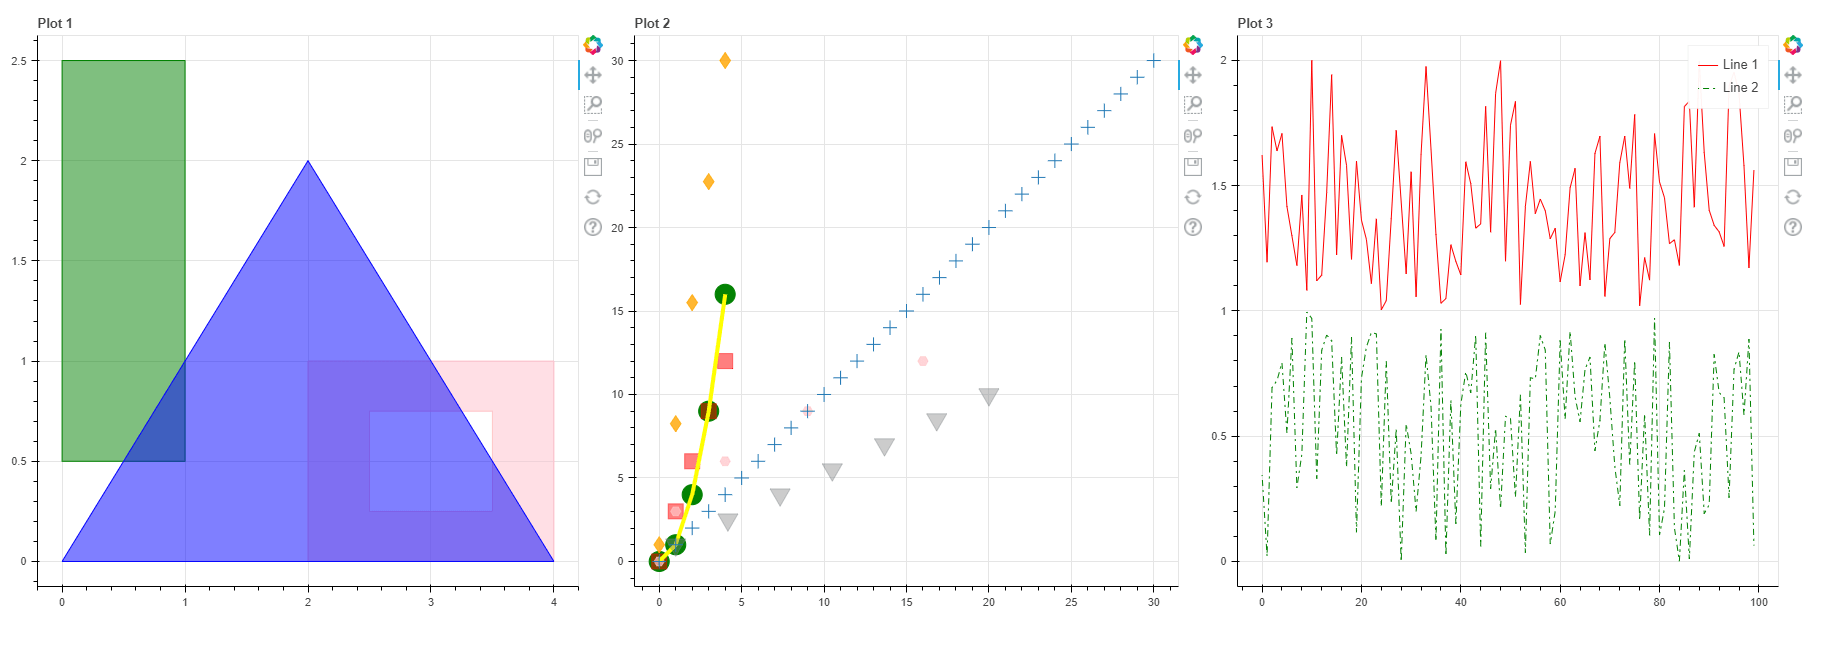
Example 3: To Plot Multiple Plots in a RowOutput: 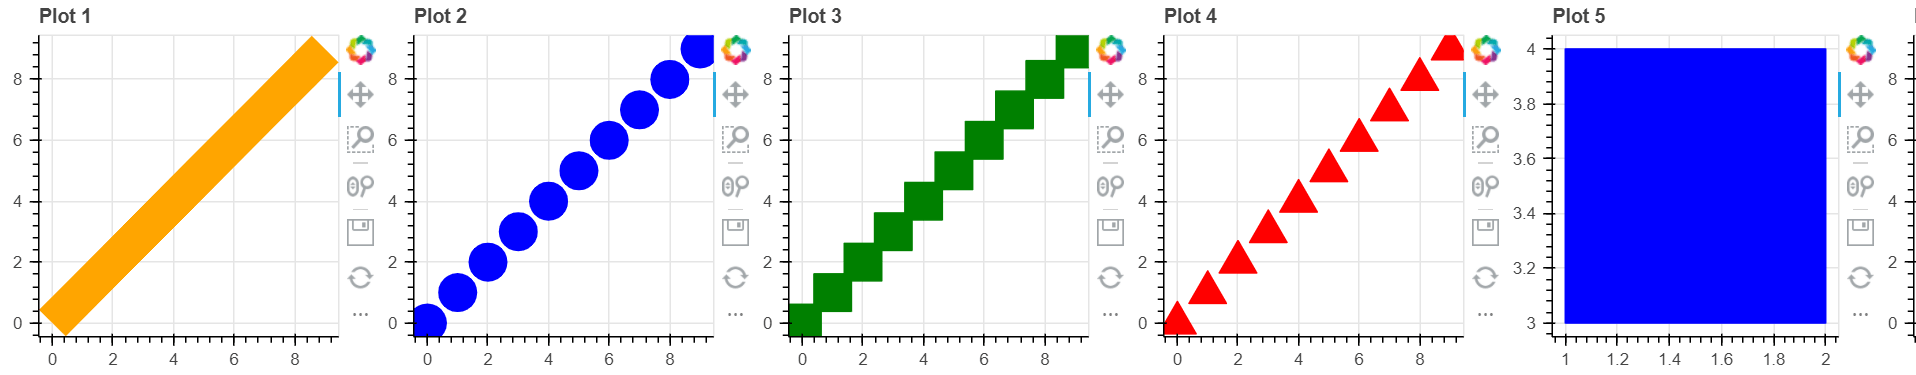
ConclusionIn this tutorial, we have discussed how we can create multiple plots on the same page or frame. |
 For Videos Join Our Youtube Channel: Join Now
Feedback
- Send your Feedback to [email protected]
Help Others, Please Share


