| |

Python - Log Laplace Distribution in StatisticsIn statistics, where data can assume many shapes and behaviors, distributions are crucial for understanding and modeling real-world phenomena. Among these, the Log-Laplace distribution is a versatile option for capturing heavy-tailed data patterns with a distinct logarithmic shape. With applications from financial modeling to anomaly detection, this distribution offers insights into scenarios where extreme events play a significant role. In this article, we embark on a journey to unravel the intricacies of the Log-Laplace distribution. We will delve into its mathematical formulation, explore its unique properties, and demonstrate how to harness the power of Python's statistical libraries to work with and visualize this distribution effectively. Whether you are a statistician, data scientist, or curious learner, this exploration promises to shed light on a distribution that finds its relevance in various domains. What sis Log - Laplace DistributionThe Log-Laplace distribution is a continuous probability distribution used in statistics to model data that displays heavy-tailed behavior and a distinctive logarithmic shape. This distribution is characterized by its probability density function (PDF), which incorporates the natural logarithm of the random variable. The resulting curve exhibits symmetry and heavy tails, making it suitable for scenarios where extreme events are more likely than in a Gaussian (normal) distribution. The Log-Laplace distribution finds applications in fields such as financial modeling, extreme value analysis, and anomaly detection, where accurately representing heavy-tailed data patterns is essential. Mathematical Formulation:The Log-Laplace distribution is characterized by its probability density function (PDF), which represents the likelihood of observing a specific value of a random variable. For the Log-Laplace distribution, the PDF is given by: Here:
The presence of the logarithm in the PDF introduces the logarithmic shape, and the parameter b influences the spread of the distribution. Notably, the PDF ensures that the area under the curve integrates to 1, preserving its properties as a probability distribution. Properties of Long - Laplace DistributionsThe Log-Laplace distribution possesses several distinctive properties that make it a valuable tool for modeling data with heavy-tailed behavior and a logarithmic shape. Let's delve into these properties in detail: Symmetry and Logarithmic Shape: The Log-Laplace distribution exhibits symmetry around the vertical axis, much like the standard normal distribution. However, what sets it apart is its characteristic logarithmic shape. This shape arises due to the presence of the natural logarithm in its probability density function (PDF). As a result, the distribution's curve takes on a bell-shaped appearance, reminiscent of the normal distribution, but with heavier tails. Heavy Tails: A key property of the Log-Laplace distribution is its ability to capture heavy-tailed behavior. Heavy tails indicate extreme values with higher probabilities than the Gaussian distribution. In scenarios where rare and extreme events play a significant role, the Log-Laplace distribution provides a more appropriate model. This makes it well-suited for situations where extreme observations are more common than expected under a Gaussian assumption. Scale Parameter b: The scale parameter b is a critical component of the Log-Laplace distribution. It determines the distribution's shape and spread. A larger value of b leads to a more compact distribution with less heavy tails. Conversely, a smaller value of b results in a wider distribution with heavier tails. This parameter provides flexibility to adjust the distribution's behavior according to the specific characteristics of the data. Applications in Modeling Extreme Events: The Log-Laplace distribution finds applications in various fields, particularly when modeling extreme events or data with rare occurrences. Some notable applications include financial modeling, where asset returns can exhibit heavy-tailed behavior due to rare market shocks. It is also relevant in extreme value analysis, where rare and exceptional events like natural disasters are studied. The Log-Laplace distribution is also employed in anomaly detection systems to model unusual and outlier data points. Modeling Non-Normal Patterns: While the Gaussian (normal) distribution is widely used due to its simplicity and well-understood properties, many real-world datasets exhibit patterns that deviate from a normal distribution. The Log-Laplace distribution offers an alternative that accommodates the logarithmic shape and heavy-tailed behavior, making it a more accurate model for such datasets. Complementary to Other Distributions: The Log-Laplace distribution complements heavy-tailed distributions like the Pareto distribution and the generalized extreme value distribution. Depending on the characteristics of the data and the research objectives, researchers and analysts can choose the distribution that best captures the data's behavior. In conclusion, the Log-Laplace distribution's properties, symmetry, logarithmic shape, and heavy tails make it a powerful tool for modeling data that exhibits extreme events and non-Gaussian behavior. Its flexible scale parameter and relevance in various applications underline its significance in statistics and data analysis. Real-Life ApplicationsThe Log-Laplace distribution finds application in various fields because it can accurately model data with heavy-tailed behavior and a logarithmic shape. Let's explore its applications in detail: The Log-Laplace distribution finds applications in various domains because it can model heavy-tailed data more accurately than the Gaussian distribution. Some notable applications include: Financial Modeling: In finance, asset returns often exhibit extreme events that can lead to non-Gaussian behavior. Market crashes, sudden spikes, and other rare events can significantly impact financial data. The Log-Laplace distribution provides a suitable framework for modeling such heavy-tailed behavior. Financial analysts and risk managers can make more accurate assessments of market risk, portfolio performance, and the potential impact of extreme market movements by accounting for extreme events. Extreme Value Analysis: The Log-Laplace distribution is valuable in extreme value analysis, which involves studying rare and extreme events. Whether it's maximum daily temperatures, flooding levels, or the magnitude of earthquakes, the Log-Laplace distribution can better fit the tails of the distribution compared to more standard distributions. This distribution helps researchers estimate the likelihood of rare occurrences and plan for worst-case scenarios in areas such as environmental science and engineering. Anomaly Detection and Outlier Analysis: Anomaly detection involves identifying data points that deviate significantly from the norm. The Log-Laplace distribution is well-suited for modeling these anomalies, as it captures the heavy-tailed nature of outlier data points. Using the Log-Laplace distribution, analysts can distinguish between usual data patterns and exceptional observations, essential in fields like fraud detection, network security, and quality control. Environmental Science: Environmental data often exhibits irregular patterns and rare extreme events. The Log-Laplace distribution can effectively model variables like rainfall, river discharge, and pollutant concentrations that may experience infrequent but impactful occurrences. This enables scientists better to understand the frequency and magnitude of extreme environmental phenomena. Insurance and Risk Management: The insurance industry deals with the assessment of risks associated with rare and catastrophic events. The Log-Laplace distribution's ability to accurately model heavy-tailed behavior makes it valuable for pricing insurance policies, estimating potential losses, and calculating reserves for rare but high-impact claims. Biomedical and Health Data Analysis: In medical research, there are instances where data can exhibit extreme values due to rare diseases, adverse drug reactions, or other exceptional health events. The Log-Laplace distribution can be employed to model such data patterns, aiding in identifying potential health risks and developing appropriate interventions. Econometrics and Income Distribution: The Log-Laplace distribution can be used to model income distributions, especially when rare high-income individuals or extreme poverty levels need to be accurately represented. This is relevant in studies of income inequality and poverty analysis. Complementary to Other Distributions: The Log-Laplace distribution complements heavy-tailed distributions like the Pareto distribution and the generalized extreme value distribution. Depending on the characteristics of the data and the research objectives, researchers and analysts can choose the distribution that best captures the data's behavior. In conclusion, the Log-Laplace distribution's properties, symmetry, logarithmic shape, and heavy tails make it a powerful tool for modeling data that exhibits extreme events and non-Gaussian behavior. Its flexible scale parameter and relevance in various applications underline its significance in statistics and data analysis. The Log-Laplace distribution's ability to capture both heavy-tailed behavior and logarithmic shape makes it a versatile tool in fields where rare events and non-Gaussian patterns play a crucial role. Its applications span diverse domains, enabling researchers, analysts, and practitioners to make informed decisions, assess risks, and better understand the behavior of complex data. Python ImplementationPython's scientific libraries, such as SciPy, provide convenient tools for working with the Log-Laplace distribution. Here's how you can generate random numbers and visualize its PDF: 1. Creating Log-Laplace Continuous Random Variable:Creating a Log-Laplace continuous random variable involves generating random numbers that follow the Log-Laplace distribution. This can be achieved using a random number generator function that takes parameters such as the distribution's scale parameter (b). For example, in Python's SciPy library, you can use the loglaplace.rvs() function to generate random Log-Laplace variates. 2. Log-Laplace Continuous Variates and Probability Distribution:Log-Laplace continuous variates are the random numbers generated from the Log-Laplace distribution using the abovementioned method. These variates follow the properties of the Log-Laplace distribution, such as heavy tails and a logarithmic shape. The probability distribution represents how likely it is to observe specific values of a random variable. In the context of Log-Laplace, the probability distribution function (PDF) describes the likelihood of observing different values according to the Log-Laplace distribution formula. 3. Graphical Representation:Graphical representation helps visualize the Log-Laplace distribution. A common visualization is creating a histogram of the generated random variates along with the Log-Laplace distribution's probability density function (PDF) curve. This allows you to observe and compare the data's distribution to the expected theoretical distribution. 4. Varying Positional Arguments:Positional arguments are the values you pass to a function based on their position or order in the function's parameter list. In the context of the Log-Laplace distribution, varying positional arguments could refer to changing parameters like the scale parameter (b) when creating random variates or calculating the PDF. By adjusting these arguments, you can explore how the distribution changes in response to different parameter values. For instance, you can create multiple plots with varying scale parameters to see how they affect the distribution's shape and spread. Example:Output: 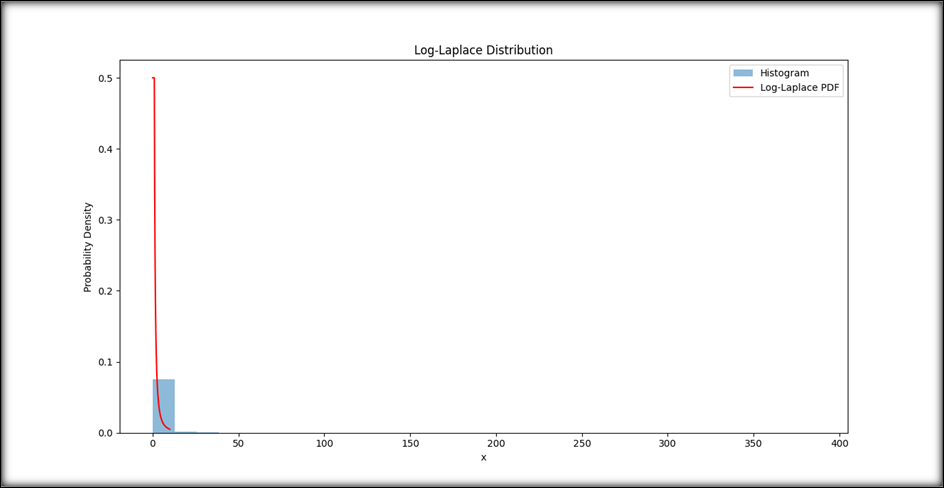
ConclusionIn a world of outliers and surprises, the Log-Laplace distribution is the tool that helps us decipher the language of uncertainty, making sense of the remarkable and the rare. In the intricate data analysis landscape, the Log-Laplace distribution emerges as a compass guiding us through the uncharted territories of heavy-tailed patterns and exceptional occurrences. Much like life, this distribution acknowledges the unpredictability of extreme events and captures their essence precisely. With its logarithmic shape and heavy tails, it mirrors the ebbs and flows of reality-where outliers are not merely exceptions but crucial insights. From financial markets to environmental studies, the Log-Laplace distribution finds its place as a versatile lens to comprehend the world's nuances. Bridging the gap between theory and application empowers us to understand better, model, and anticipate the unexpected. Just as every chapter has outliers, every dataset has unique stories; the Log-Laplace distribution equips us to tell these stories with accuracy and depth. In this data exploration journey, it becomes our trusted companion, revealing the extraordinary in the ordinary and unraveling hidden narratives in the fabric of statistics.
Next TopicPython OpenCV | cv2.cvtColor() Method
|
 For Videos Join Our Youtube Channel: Join Now
Feedback
- Send your Feedback to [email protected]
Help Others, Please Share


