| |
Python Tutorial
Python OOPs
Python MySQL
Python MongoDB
Python SQLite
Python Questions
Plotly
Python Tkinter (GUI)
Python Web Blocker
Python MCQ
Related Tutorials
Python Programs

How to Plot Histogram in Python?What is Histogram?A histogram is a visual depiction of a frequency distribution table with continuous divisions that have been grouped. A series of rectangles with foundations equal to the distances between class bounds and areas proportionate to the frequency in the associated classes make up the area diagram. Since the ground in such representations spans the spaces between class bounds, every rectangle is adjacent. Rectangle altitudes are inversely correlated with comparable frequencies for similar groups and inversely correlated with frequency densities for other classes. In other terms, a histogram is a figure with rectangles whose breadth is equal to the class spacing and whose area is directly related to the frequency of the variable. When to Use Histogram?The histogram diagram is employed in specific circumstances. As follows:
Types of HistogramThe histogram could be divided into many forms depending on the data's frequency distribution. There are various distributions, including the gaussian distribution, the bimodal distribution, the skewed distribution, the comb distribution, the edge peak distribution, the multimodal distribution, the dog food distribution, and so on. The histogram can represent these multiple sorts of distributions. The various histogram types are:
Plotting Histogram using MatplotlibBins are defined as successive, non-overlapping ranges of variables. The matplotlib.pyplot.hist() method is used to calculate and generate the histogram of the variable x. Creating bins of the complete range is the first stage in creating a histogram. In the next step, distribute the entire range of numbers into the series of intervals created in the first step, and count the values that drop into every interval. Let's construct a simple histogram using some arbitrary values. The simple histogram made using the code below has some random values: Code Output: 
Modifying the Histogram in MatplotlibA variety of techniques are available in Matplotlib to personalize the histogram. The matplotlib.pyplot.hist() method offers many attributes we can use to customize a histogram. The hist() method offers a patches object that provides accessibility to the produced objects' properties, allowing us to change the plot as we see fit. Code Output: 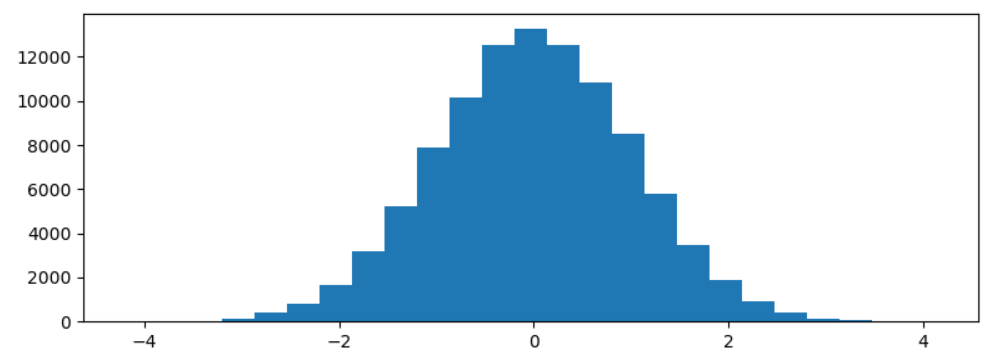
The histogram generated above is modified using the code below for a clearer view and more precise readings. Code Output: 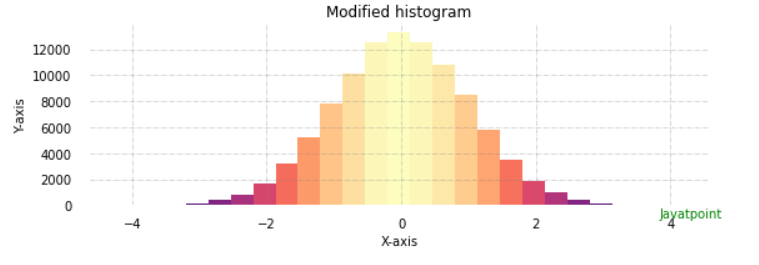
|
 For Videos Join Our Youtube Channel: Join Now
Feedback
- Send your Feedback to [email protected]
Help Others, Please Share


