| |

pdicting Rideshare Fares using PythonThe taxi service market has been flourishing recently, and substantial expansion is pdicted shortly. Numerous businesses have emerged to cater to this increased demand for cab tours. Few businesses, nevertheless, charge more for the same tour. Customers are forced to pay excessively, even if the costs need to be lower. The major goal is to pdict tour expenses before making a taxi reservation to maintain openness and pvent unfair practices. Project initiatives:
The first significant American city to reveal detailed ridesharing statistics from firms like Lyft, Uber, and Via was Chicago_city. The information initially became public in April 2019 and pertained to journeys conducted since November 2018. The tours, motorists, and vehicle databases can provide information on the pricing strategies used by rideshare companies as well as insights into the behavior of the passengers. A few articles are on pricing (Reuter-Uber drivers raise fares) and passenger behavior (Rideshare Data). Reuter's investigation indicated that the price hikes for shared rides mostly impact Chicago_city's low-income neighborhoods. At the same time, Storybench's study found that journeys typically concentrate around early night commuting hours and "nightlife" hours. These are the contexts in which I am working to develop artificial intelligence models that forecast ridesharing prices. The DatasetEach journey's details are included in the tour data, such as the start time, finish time, distance traveled, starting and ending points, etc. You can get more thorough data explanations and the data's source from online sources. Chicago_city does many data modifications, including suppssing Census Tracts and rounding times to the closest 15 minutes. The closest $2.50 is added to the fare, and $1 is added to the tip. The modeling data includes more than 7 million rows and consists of travels performed in December 2019.
Weather DataNOAA (National Centres for Environmental Information) is the source of the weather information for Chicago_city for December 2019, including pcipitation, temperature, hourly visibility, hourly wind direction, and hourly wind speed. All information about Chicago_city is collected from a station located at O'Hare International Airport for the sake of simplicity. Data WranglingSince the weather data period is erratic, the data must be reconfigured to a 15-minute evenly spaced time series before being coupled with the tour date. Here is some code that will space the data equally. The start and finish timings of the journey were entered into RStudio as factors, with the night and afternoon times being expssed in a 12-hour format. These must be transformed into dates with a local timezone and a 24-hour format. For the travels, we additionally defined variables for the riding day, hour, day of each week, and date. Source Code Snippet Output: After filling in missing values, the weather data looks like this:
VisualizeTo make sure there are no errors, gaps in the data, etc., we pfer to start by visualizing the complete dataset. The three programs, skimr, visdat, and inspectdf, are excellent. A wide range of tools for displaying your data and underlying factor distributions are included in all three packages. Source Code Snippet Output: 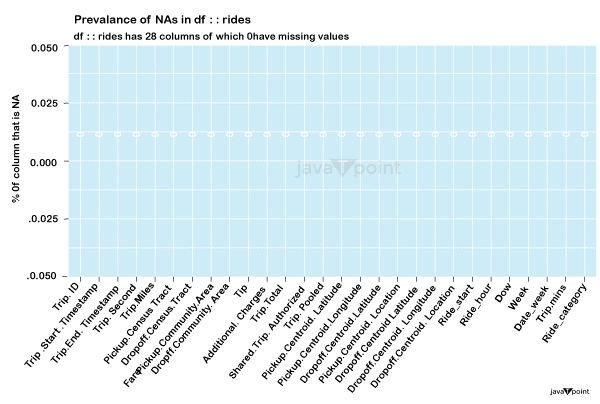
Source Code Snippet Output: 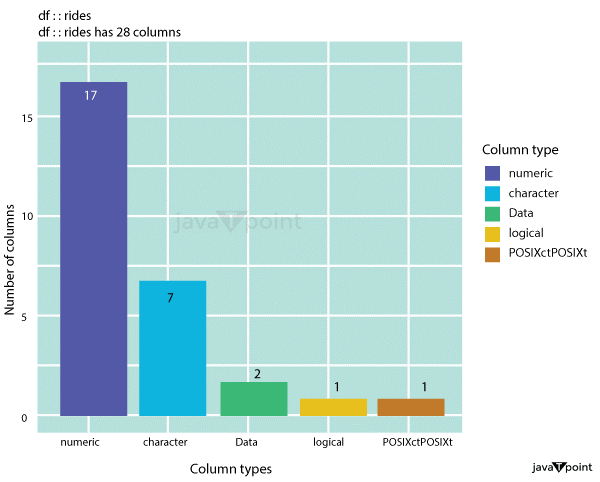
Visualize the tours by an hour of the dayWe want to see tours across two levels (the week, days or and time of the day). The picture below displays the number of tours taken per hour across the days of the week. Specifically, therides.chicago_citydata frame is piped (%>%) over to thegggplot2 functions to create histograms and then faceted by the days of the week to show the rides-per-hour breakdown across each day. Source Code Snippet Output: 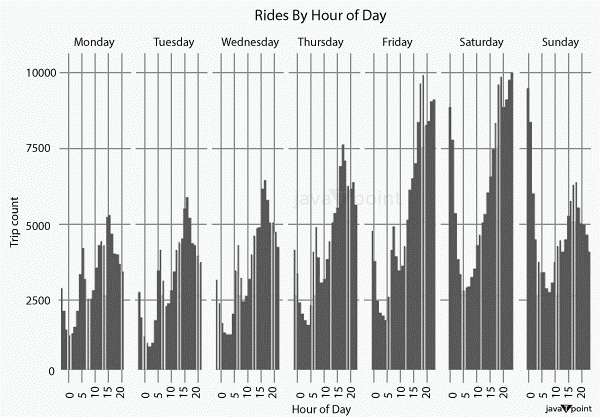
The plot below shows the tips given at different tour durations. We can sample our data usingdplyr: :sample_frac() function for a more manageable data set. We group these data by the two variables of interest (tipperandride_category1), then create a mean of the tour duration (mean_tour_mins1) for a more interptable visualization across these groups. Source Code Snippet Output: 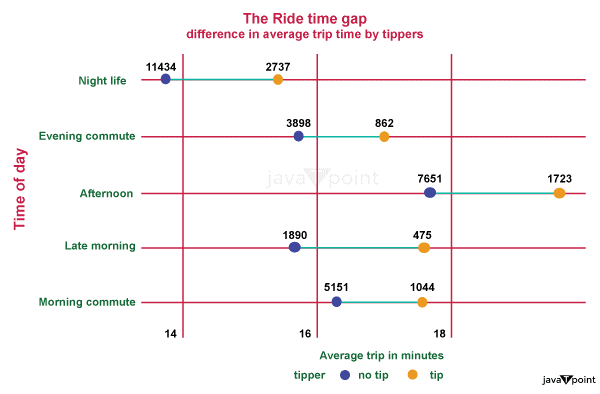
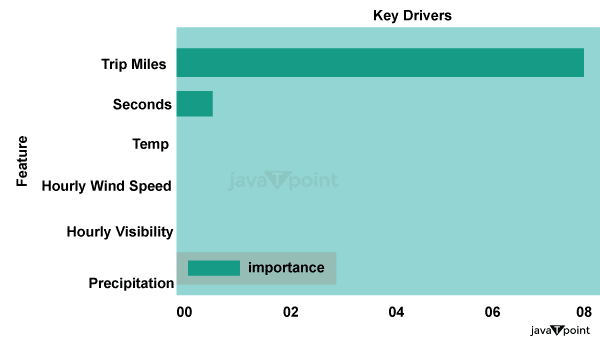
Motivating passengers to tip is another payment source that benefits drivers. Tipping is less common than not tipping, at this point where knowing more about the metrics influencing tip behavior could be point of interest. ML ModelsWe evaluate three well-known tree-based models: model name- Random Forest, model name- gradient booster, and model name- XG Boost. Below are some code snippets for each model's setup, along with a brief overview of each one. 1. Rough ForestA group of decision trees is known as a random forest. A random sample of the dataset is used to train each decision tree. Then, using ensemble techniques, a forecast is made using the entire forest by averaging the pdictions of the trees. Source Code Snippet 2. Gradient Boosting MachinesAnother ensemble technique built on decision trees is GBM. Sequentially including trees makes an effort to boost the theatricality of the group. Source Code Snippet 3. XGBSoostAnother ensemble approach that employs an augmenting gradient framework based on decision trees is XGBS. Because XGBSoost includes so many complex parameters, it's crucial when utilizing XGBS to tune the hyper-parameters to select the best configuration. Source Code Snippet Results These tree-based models have strong pdictive abilities, as shown by R-squared values higher than 95% acquired from test datasets. It should be no surprise that tour miles and seconds are the two most crucial factors. The value of weather-related data needs to be higher. The use of temperature and pcipitation data in this context without any modifications, such as considering variations in pcipitation over time, may have reduced the pdiction ability of such variables.
Trip miles are the most significant attribute when visualizing a Random Forest model tree. 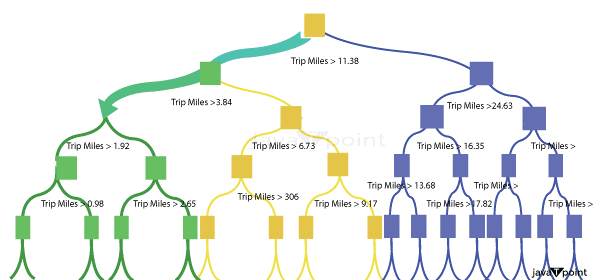
Next stepsWhat do we notice?Rideshare excursions typically occur during "nightlife" hours and early morning commuting times. Unsurprisingly, Fridays and Saturdays see a particularly large increase in "nightlife" hours, whereas Sunday night sees a marked decrease. Furthermore, behavioral gaps affect how engaged our passengers are with the goods and their drivers. Tipping is one of those behaviors. Overall, tipping is uncommon, but the time of day impacts a passenger's inclination to tip more than the length of the tour. Longer travels frequently occur early in a week, which raises the possibility that a passenger may need to make an initial tour for the week. Thanks to these visualizations, we identified certain trends and connections between time, frequency, and behavior in the Chicago_city ridesharing data. The next step may be a static report, Ppt psentation, or PDF. In a perfect world, we could develop an intervention, plan an experiment, and create a dashboard displaying ongoing research findings and real-time data. ConclusionMachine learning models based on trees are tested and evaluated to determine how well they can forecast ridesharing prices. Even though these models have excellent forecasting abilities, more gains can be made by transforming weather-related variables and using more pcise location data.
Next TopicPython eval() vs. exec()
|
 For Videos Join Our Youtube Channel: Join Now
Feedback
- Send your Feedback to [email protected]
Help Others, Please Share


