| |
Python Tutorial
Python OOPs
Python MySQL
Python MongoDB
Python SQLite
Python Questions
Plotly
Python Tkinter (GUI)
Python Web Blocker
Python MCQ
Related Tutorials
Python Programs

How to Plot the Google Map using folium package in PythonThe folium package is built on the data wrangling strengths of the Python ecosystem and the mapping strengths of the Leaflet.js library of JavaScript language. The user can manipulate their data by using Python and then visualize it by using Leaflet.js map through folium package. Folium package is an easy approach of visualizing the data on Leaflet.js map, which has been manipulated by using Python. Required Module and LibrariesFolium: The user can install the Folium package by using the following command. Geopy: The geopy module of Python makes it easy for Python users to locate the coordinates of landmarks, cities, countries on the earth's surface. For installing the geopy module, the user can use the following command: After successful installation of the both libraries, we follow the below steps to plot Google map. Step 1: Create the Base mapThe user can create the base map by using the following program: Output: 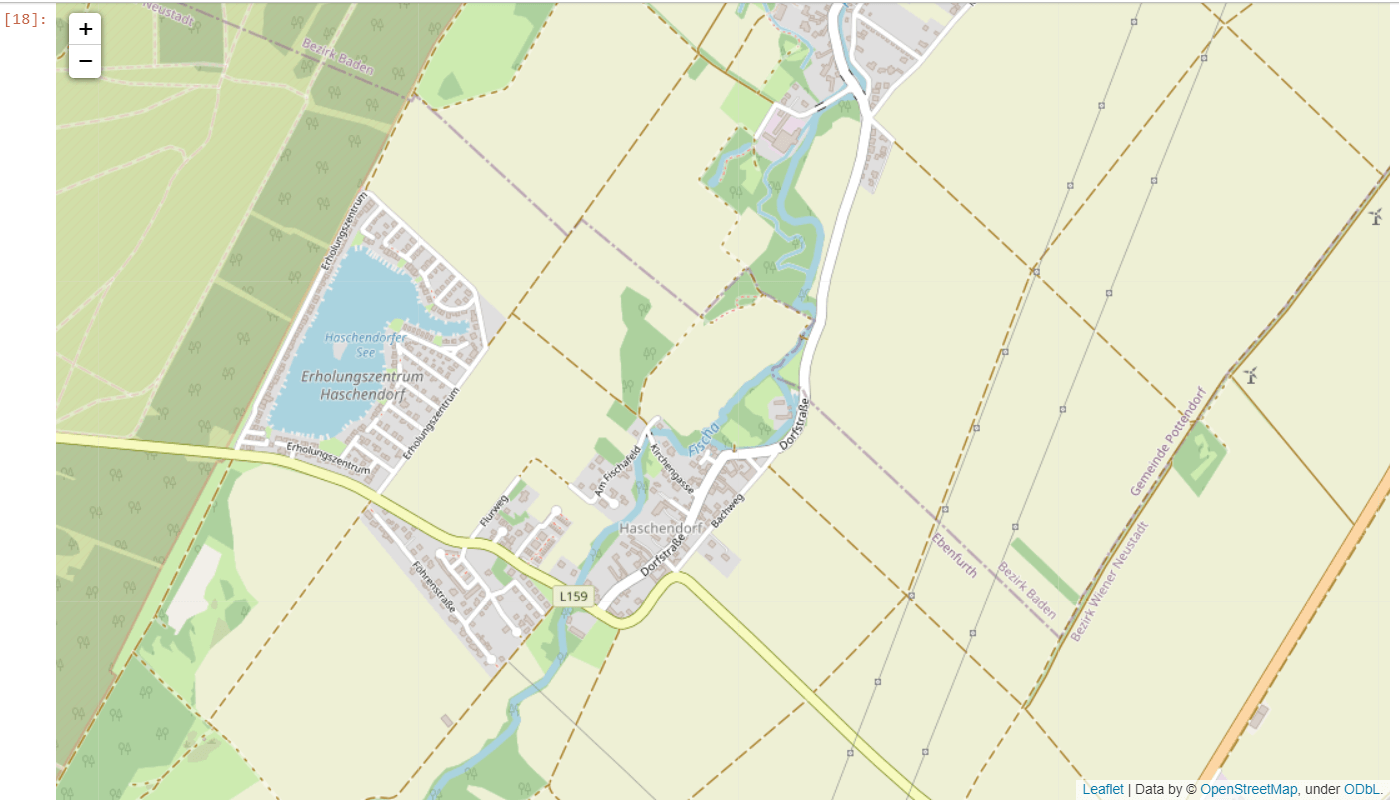
Step 2: Add a Circular MarkerThe user can mark the area with the circle and popup text by using the following code: Output: 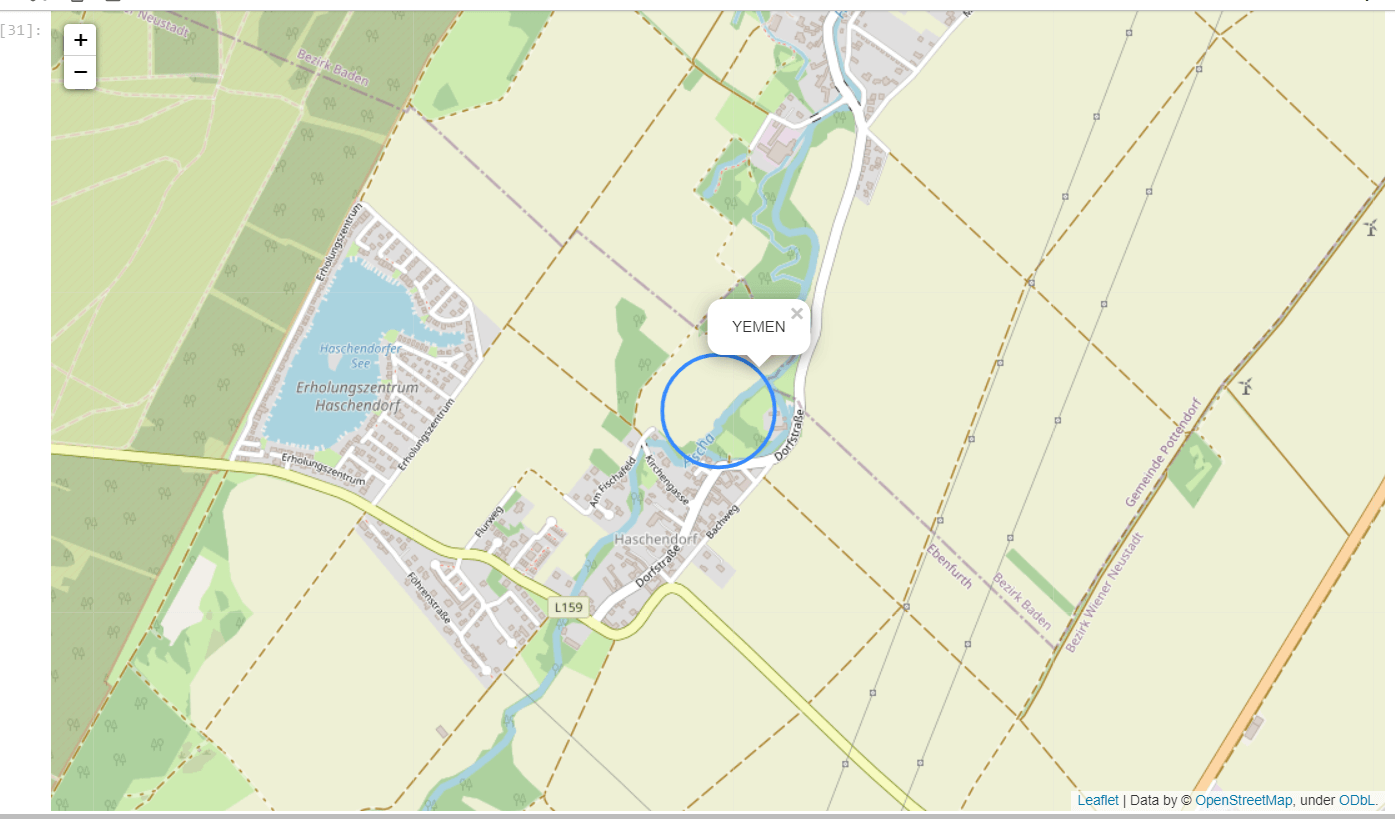
Step 3: Add the simple marker for the parachute style marker with the popup textThe user can use the following code. Example - Output: 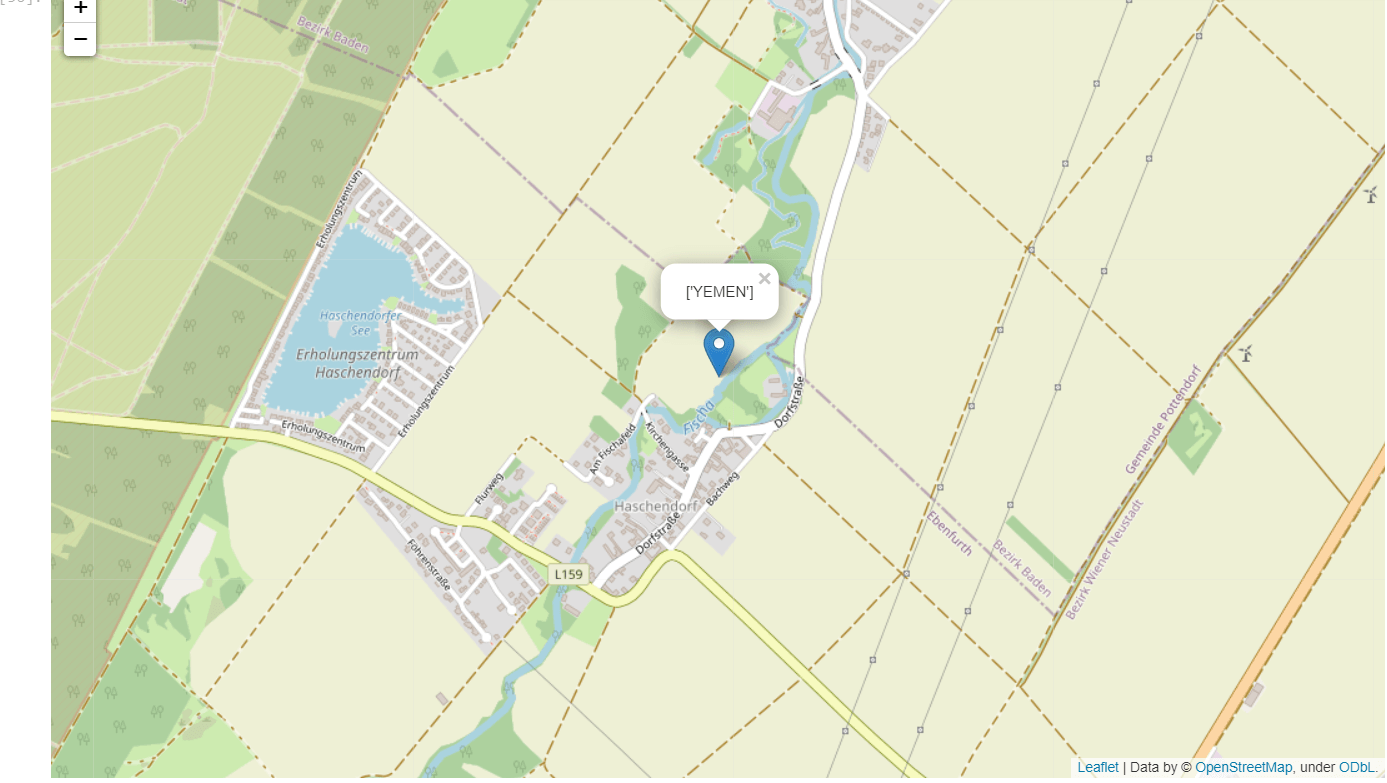
Step 4: Add the line on the mapThe user can use the following code for adding the line on the map to join the two coordinates. Example - Output: 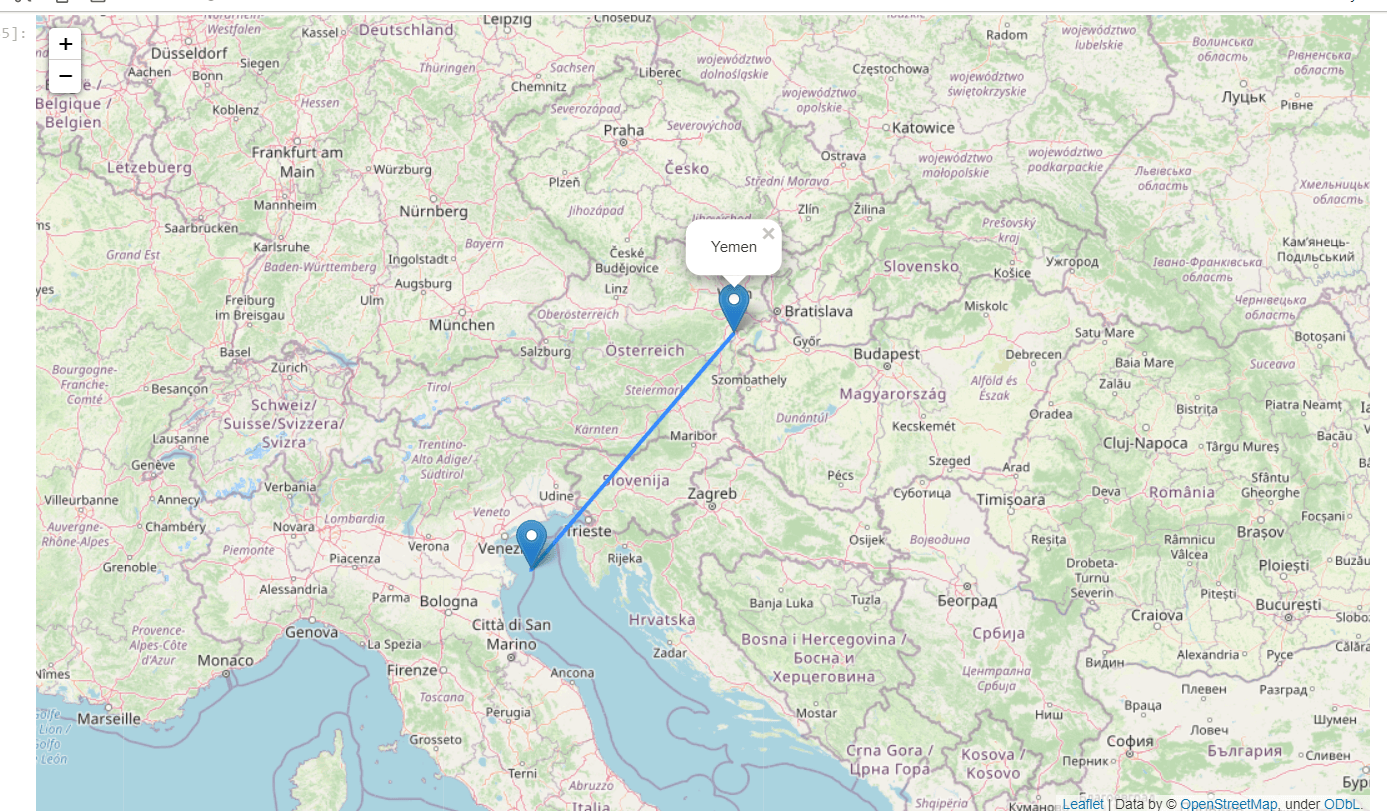
Explanation We used the geopy library to get the latitude and longitude of the location. Then we used the "folium.map" method of the folium package for creating the base of Google Maps. In step 2, we used "folium.CircleMarker" for marking the circular mark on the location with the pop-up text. In step 3, we used "folium.Marker" to add a parachute style mark on the mentioned location. In the last step, we used "folium.PolyLine" for joining two marks on two different locations on the map. ConclusionIn this tutorial, we have shown how the user can Plot the Google map and add different required functionalities on the map like a circular mark, parachute mark, pop-up text, and the line joining the two coordinates on the map.
Next TopicGrid Search in Python
|
 For Videos Join Our Youtube Channel: Join Now
Feedback
- Send your Feedback to [email protected]
Help Others, Please Share


