| |

Python MayaVi ModuleWe all may have heard about Graphical User Interface, known as GUI, and we must have seen its impact in the changing interface of many applications. Basically, GUI or Graphical User Interface is a type of User Interface for applications and software which, instead of text-based user interfaces & typed command labels, allow the users to interact with the computers, smartphones, PCs, etc., through audio indicators and graphical icons such as notations, etc. GUI displays objects and data in such a manner that the information we are trying to display is conveyed very easily through the interactive User Interface provided. Whenever the user interacts with the applications, the object displayed on the electronic devices changes its color, text, and sometimes shape too. Thus, it makes the user's interaction with the electronic devices or applications become more interactive and interesting for the users. We can see how important GUI has become in today's world, and we can find its use in almost every application we use in our daily lives. Therefore, it becomes even more important that we should have an idea of how to build a GUI and work with it. Most of the programming languages provide us option to create interactive GUIs with the help of their in-built libraries or extensions connected with them. But Python is one of the most popular choices among all these programming languages for creating GUI because it provides us with multiple libraries through which we can easily create a GUI. In Python, we have many in-built modules and some installable modules that we can use to create an interactive GUI by using the functions of these modules in a program. One such Python module is the MayaVi module about which we are going to learn in this tutorial. We will learn about the MayaVi tutorial, how we can install it, its features, and many more about it in this tutorial. MayaVi Module in PythonMayaVi is a Python module used to visualize scientific data, and it uses VTK to visualize the data. Other than this, the MayaVi module also provides options to develop GUI with the help of the Tkinter library. MayaVi module, which is currently free & distributed under the BSD license, was developed by Prabhu Ramchandran, and it is pronounced as a single name, "Ma-ya-vee," which stands for "magical" in English. MayaVi is a cross-platform Python module (runs on almost every platform like UNIX, Windows, or Mac OS X), and it runs on almost every platform or operating system where both VTK and Python are available. The latest version of the MayaVi module, MayaVi2, is very much different from the original one because the latest version is a component of the Enthought suite, which is a suite for the scientific Python programs. The other reason that makes the latest version of the MayaVi module from the original version is that it provides a reusable component for 3D plotting through Python programs and does not just focus on an interactive program (the feature which was lacking in the previous version). Although the latest version of the MayaVi module has a slightly different interface and API than the previous version, it has many new features, which were missing in the previous version. MayaVi Module in Python: VisionMayaVi module, when developed, was developed with a vision to provide interactive visualization of scientific and other data, but this wasn't the only purpose of developing the MayaVi module. There were some other visions behind the development of the MayaVi module, and we are going to look at all these visions which were behind the development of the MayaVi module in this section. Following are the vision for building the Python MayaVi module:
These are the major reasons, or we can see the vision behind the development of the MayaVi module. MayaVi Module in Python: General Characteristics and FeaturesAs we have seen in the introduction part of the MayaVi module, this module provides us with multiple functions to visualize scientific data very easily. But this is not the only characteristic of the MayaVi module, which makes it stand out in all the scientific data visualization modules. It also has some other characteristics that make this module very popular in a short time, and we will discuss these characteristics and features of this module in this section. Following are the general characteristics and highlighted features of the MayaVi module:
These are some general characteristics and highlighted features of the MayaVi module, and when we go through this list, we will find why this MayaVi module became so popular in a short time. Other than the listed features above, the MayaVi module can also use as a Visualization engine for any application and data with its latest release of Mayavi2. MayaVi Module in Python: FunctionsMayaVi library is used to perform multiple functions such as visualization of scientific data, developing a Graphical User Interface, developing 2-D & 3-D figures, etc., by importing this module in a Python program. We can perform all these functions with the help of the MayaVi module or using Mayavi and some other modules together in a program, but for this tutorial, we will only learn about building a Graphical User Interface using the MayaVi module. We will use the MayaVi module with some other modules (which we will discuss later) to build a GUI through a Python program. MayaVi Module in Python: InstallationMayaVi is not an in-built module of Python that comes pre-installed with the Python extension, and therefore, we have to install this module in our system if we want to use and import this module in a Python program. Installation of the MayaVi module is very simple, and it can be done through multiple methods, which include through conda method, through Jupyter notebook method, through pip method, and many more. But in this tutorial, we will only use the pip installer method to perform the installation of the MayaVi module and install this module by using the following pip command in the terminal shell: We have to open the command prompt terminal of our system and write the command given above in it, and after writing the command, press the enter key to start the installation process of the MayaVi module. When we press the enter key, the installation process for the MayaVi module will start, and it will take a while to install the MayaVi module in our system successfully. Because the Mayavi module comes with multiple extensions and library functions, which will be downloaded and installed with it in our system, and pip will also build a wheel for it. 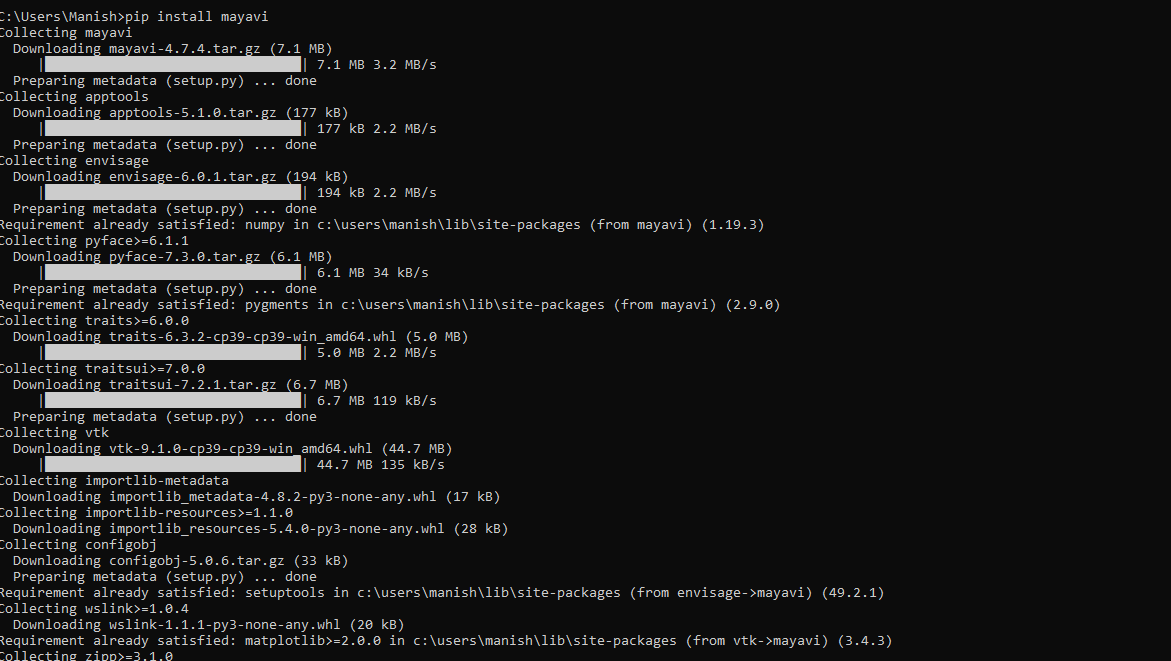
As we can see, the MayaVi module is successfully installed in our system, and now we can start working with this module by importing it into a Python program. Note: As we have to build a GUI with the MayaVi module in this tutorial, we will also need NumPy and SciPy modules to perform this implementation. We should make sure that both SciPy and NumPy modules are already installed in our system before moving further with the implementation part of the MayaVi module. If SciPy and NumPy modules are not present in our system, we can use the following pip installer command in the command prompt terminal to install them in our system:(i) For installation of SciPy Module: 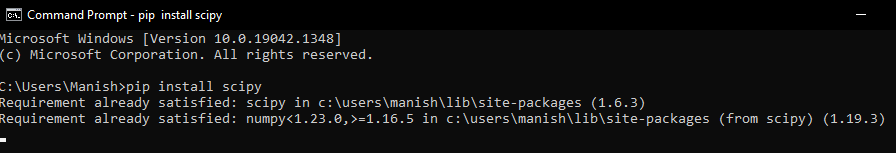
This module is already present in our system, and that's why it has shown here that requirements are already fulfilled, and if this module is not present in the system, this command will install it. (ii) For installation of NumPy Module: 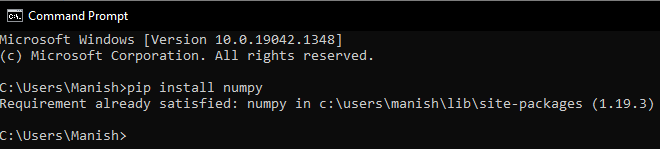
This module is already present in our system, and that's why it has shown here that requirements are already fulfilled. We have installed all the required modules for the implementation part of the MayaVi module, and therefore, now we can move ahead with the implementation part of it. MayaVi Module in Python: ImplementationIn the implementation section, we will only use the MayaVi module to implement its GUI building function, and we will build a spherical harmonic function visualization through it. We will use the MayaVi module in an example program to understand the visualization of the spherical harmonic function by plotting a Graphical User Interface for it in the output. We will also use SciPy and NumPy modules for performing scientific calculations and using trigonometric functions in the program. We can look at the following example program for the implementation of the MayaVi module with the NumPy and SciPy modules. Example: Look at the following Python program with visualization of spherical hormonic function: Output: 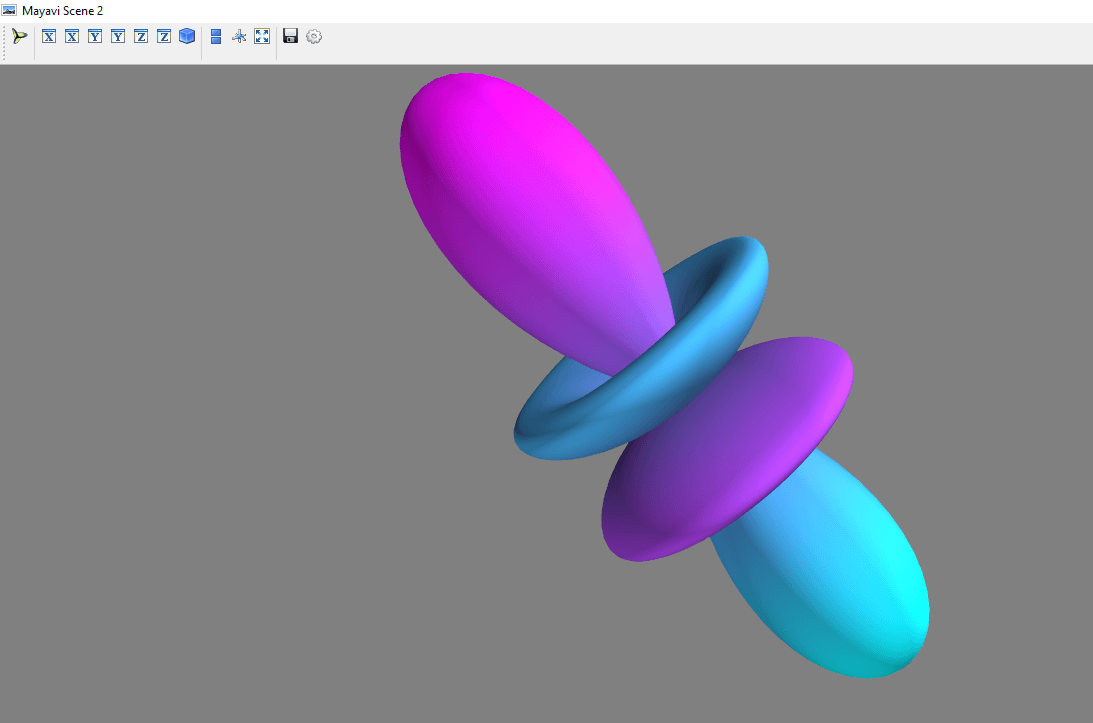
As we can see, Visualization of the spherical harmonics is plotted in the output with the specified dimensions, values, and features. Explanation: We have first imported scipy, numpy, and mayavi modules in the program. First, have imported linspace, meshgrid, array, sin, cos, pi, and abs function from the numpy module, then we imported sph_harm function as sh from scipy module, and last, we imported mlab as ml from mayavi module for visualization of spherical harmonic motion. After that, we defined 1-D angles using the linspace() function in the OneDTheta and OneDPhi variables. After that, we defined 2-D angles using the OneDTheta & OneDPhi angle in the meshgrid() function and initialized the TwoDTheta and TwoDPhi variables. After that, we defined an array, and inside the array, we used sin and cos identities with 2-D angles we defined earlier. Next, we defined the length and measurement variable with an integer value, and then we used 2-D angles, length, and measurement value inside the sph_harm() function. After that, we have initialized the radius variable to define the sphere's radius using the abs() function. Next, we used the figure() function to define the dimension of the figure, and after that, we used the mesh() function to specify the radius and colors for the figure plotted in the output. Then, we used the view() function to set the visualization for the spherical harmonics and savefig() to save the figure in the specified format. Lastly, we used the show() function to show the visualization in the output.
Next TopicPython os.listdir() method
|
 For Videos Join Our Youtube Channel: Join Now
Feedback
- Send your Feedback to [email protected]
Help Others, Please Share


