| |
Python Tutorial
Python OOPs
Python MySQL
Python MongoDB
Python SQLite
Python Questions
Plotly
Python Tkinter (GUI)
Python Web Blocker
Python MCQ
Related Tutorials
Python Programs

Packages of Data Visualization in PythonWhen working with many data sets, it might be challenging to completely understand what customers see in a tabular style. To make our data more systematic, comprehend what it means, and choose suitable models, we must visualize or represent it visually. As a result, we may see dynamics, trends, and correlations that are not visible in charts or CSV files. Visualisation of DataThe field of data analysis that focuses on visualizing data is called data visualization. It is an effective method of communicating data insights and presents data graphically. When data is presented in images, maps, and graphs, the human brain processes it quickly and easily. We can always receive a visual depiction of our data by applying data visualization. Both large and small data sets benefit from data visualization. However, it is beneficial when working with enormous data sets when it is impossible to see, interpret, and comprehend all of our records. Python Data VisualisationData visualization in Python is perhaps one of the most often utilized features for data science with Python in today's environment. Python packages provide several capabilities that let users design elegant, interactive graphs that are highly customized. Python comes with several plotting libraries, including Matplotlib, Seaborn, and other tools for data visualization. Each has a unique combination of tools for creating customized, engaging stories that are educational and effectively convey information. Python offers several libraries for data visualization, each with their capabilities. This tutorial will cover four of these libraries. Each library may support various graph types and has a unique set of functions.
We'll go over each of these libraries one after another. Useful Python Packages for VisualizationsMatplotlibA Python visualization library for 2D array plots is called Matplotlib. The NumPy library is used by the Python library Matplotlib. It is compatible with Jupyter notebooks, web application server software, and the Python and IPython shells. Various plots, including scatter, line, bar, histogram, and others, are available in Matplotlib to help us delve deeper into trends, behavioral patterns, and relationships. It was first introduced by John Hunter in 2002. Scatter Plot Using dots to indicate the correlations between variables, scatter plots can be used to visualize relationships. The scatter() method of the matplotlib library is used to produce a scatter plot. Input Output 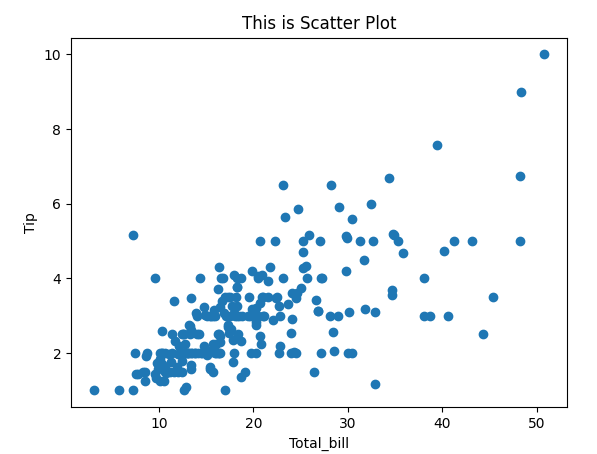
Bar Chart Using rectangular bars with lengths and heights proportional to the data values they represent to depict a category of data, a bar plot or bar chart is simply a graph. Code: Output: 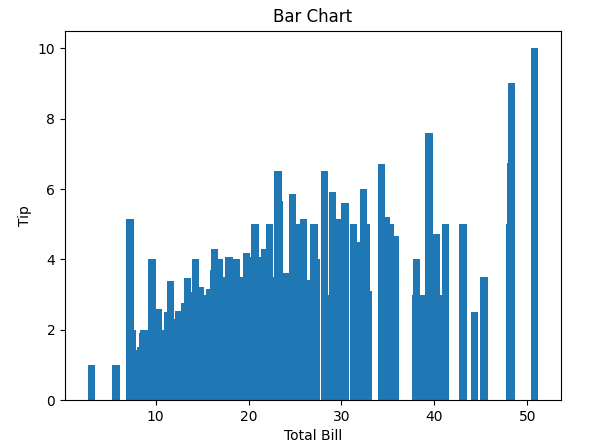
SeabornA Python module called Seaborn allows users to build statistical visualizations from datasets. It is based on matplotlib and produces many kinds of visualizations. It is based on the data structures of pandas. The library performs the necessary modeling and aggregation internally to provide illuminating graphics. Line Plot In Seaborn, a line plot was created using the line plot() method. In this situation, we may alternatively pass merely the data argument. Input Output: 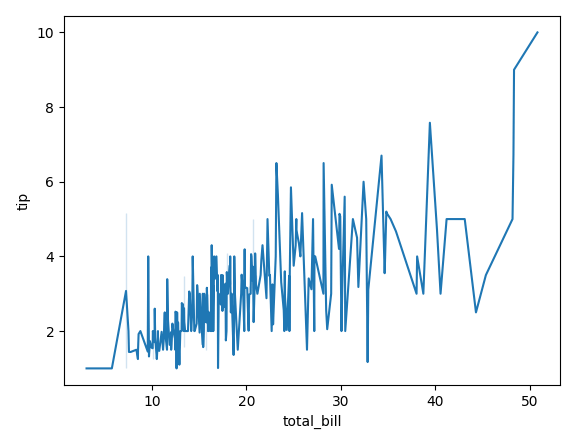
BokehBokeh is a cutting-edge interactive visualization library for web browsers. With massive or streaming data assets, it can provide exciting charts and dynamic dashboards. Numerous clear graphs in the library can be utilized to develop solutions. It is closely connected to the PyData utilities. The library is excellent for developing unique images based on specific use cases. Interactive visual effects can support a what-if scenario model. Line Chart A line plot can also be made using the line() method from the plotting and scheming module. Input Output: 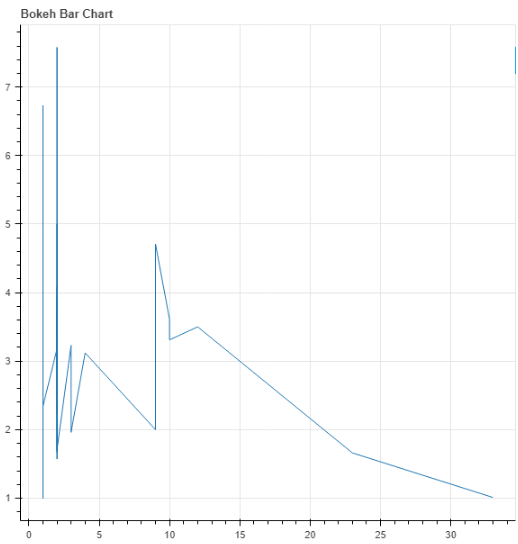
Adding Widgets
plotlyplotly.py is a high-level, declarative, interactive, browser-based Python visualization library. Visualizations are accessible, including financial charts, statistical plots, 3D charts, and scientific graphics. Plot charts can be created as standalone HTML documents, live web pages, or Jupyter notebooks. The Plotly library has possibilities for interaction and editing. The rich API runs wonderfully both locally and in a web browser. Scatter Plot The scatter() function of plotly.express can be used to create a scatter plot in Plotly. An additional data argument too is necessary here, as it is for Seaborn. Input Output: 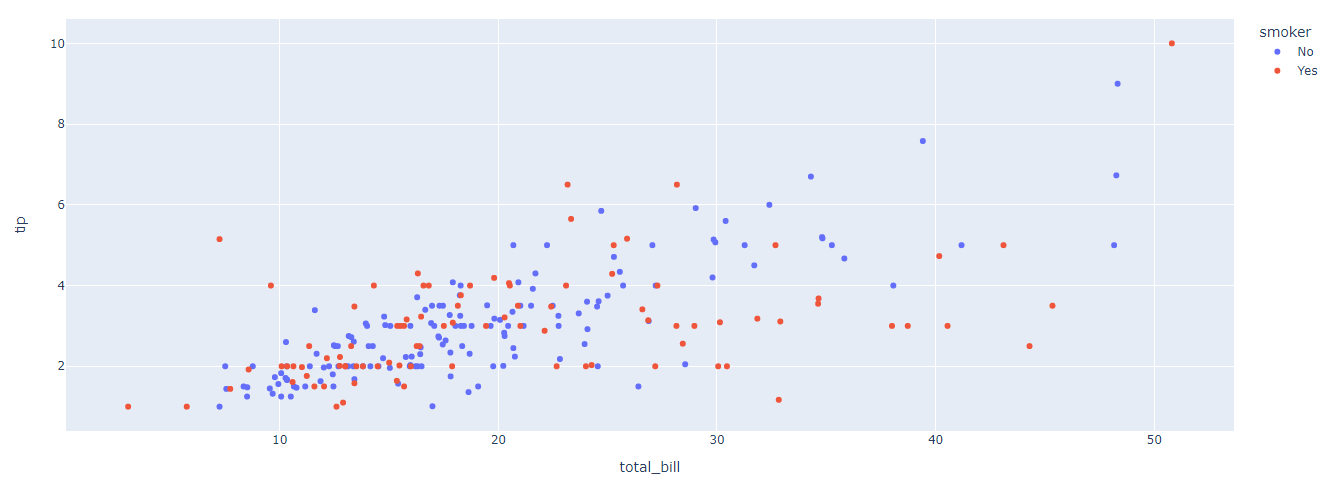
Next TopicPython pympler library
|
 For Videos Join Our Youtube Channel: Join Now
Feedback
- Send your Feedback to [email protected]
Help Others, Please Share


