| |
Python Tutorial
Python OOPs
Python MySQL
Python MongoDB
Python SQLite
Python Questions
Plotly
Python Tkinter (GUI)
Python Web Blocker
Python MCQ
Related Tutorials
Python Programs

Hypothesis Testing of Linear Regression in PythonLinear regression models in Machine Learning are used to predict the future values of an attribute. In this model, we have specific independent attributes, also known as predictors. The model takes in these predictors, fits a straight line to the data, and gives us a model to predict the value of the dependent attribute using specific values of these independent attributes. By fitting, we mean optimizing the parameters to get an optimal solution. We can try different combinations of the independent attributes to find which predicts the value more accurately. However, this method takes a lot of work. But the question arises of how to find which attribute is crucial for the model, which is too quickly. There are many ways, such as the adjusted R-squared error and Mean Squared Error, in which we find the values of a dependent attribute using the model and find the difference in actual and predicted values to judge the model's accuracy. Another statistical approach to solve this problem is Hypothesis Testing. We will create a hypothesis, calculate the value of the statistic, and according to the level of significance and p-value, judge the quality of the model fit. What do we do in Manual Feature Elimination?Following are the steps that need to be followed:-
Usually, researchers advise one to maintain a balance between automated and manual selection to get an optimal number of features. We will discuss how to use Hypothesis Testing in the selection of the features. Before going to hypothesis testing, let us understand the Linear Regression model and its parameters. In linear regression, we fit a straight line to the data. A straight line has the following equation:- 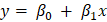
Where y is the independent feature, is the intercept of the straight line, and is the slope of the straight line. For simplicity, we are using only one independent feature. Since we are considering more features than the model's overall fit, we will ignore them. We will focus on the slope of the line, i.e., the feature's coefficient. We will use the built-in diabetes dataset and its two features, one independent and one dependent feature. Code Output: 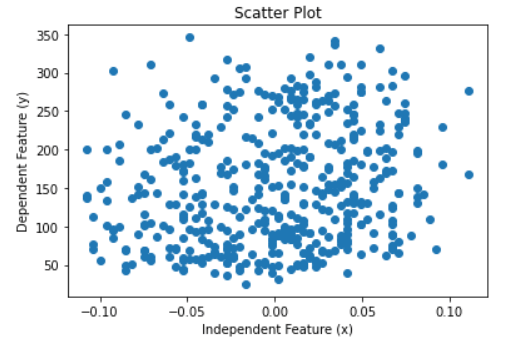
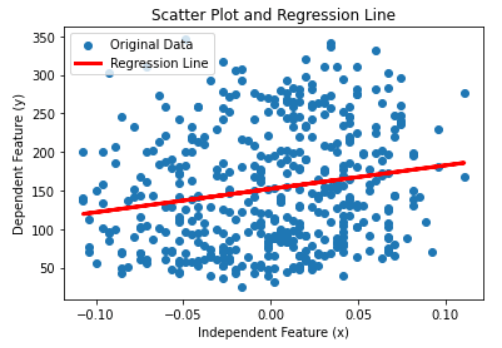
Scatter PlotWe will fit a regression model to the dataset and plot the regression line. Code Output: The intercept of the linear equations is 152.13348416289594 and the slope of the line is 304.18307452830607 It is clear from the graph that the plot is randomly scattered, and there is no trend in the two features. Even if the plot has not followed a linear trend, Python would fit a linear model to the data. However, in this case, the error term would be huge and accuracy very low. Thus fitting a linear line does not imply that the data can be explained through a regression line. Therefore, we need other measures to determine if the feature is right for the ML model we are working on. In our example, to test if x has importance, we will run a hypothesis test on. Steps to perform a Hypothesis Test
Step 1We will start by stating the hypothesis. The hypothesis will be based on the value of β1. Since this is the null hypothesis, we have to declare an equality statement related to β1. We will assume that this β1 is not significant. This means that x and y have no relationship between them. This will happen when the slope of the line is zero. Hence, β1=0 Null Hypothesis (H0): β1=0 Alternative Hypothesis (HA): β1≠0 Step 2Now we have to set a boundary to tell if we should accept or reject the null hypothesis. Usually, the values of the level of significance are 1%, 5%, and 10%. We will take the level of significance as 5%. Step 3Now comes the main part of hypothesis testing. We have to calculate the test statistic, which will measure the significance of x in the regression model on y. We will compare the test statistic value with the level of significance to decide on the significance of x. However, the test statistic is not directly compared with the level of significance. We compare the p-value corresponding to the calculated value of the test statistic. Let us see what this means. We will calculate the t-score value for the mean of the independent feature x. 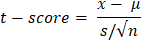
Where μ is the population's mean and s is the standard deviation of the selected sample. N is the number of samples. Together s/√n is known as standard error. Now, we have to find the p-value. We will use the cumulative probability table for the t-distribution, also known as the t-table, to find the p-value for the t-score. Decide on the basis of the p-value with respect to the given significance level value. Step 4Now, we will see the rule to accept or reject the null hypothesis. In the below rule, 0.05 is the level of significance. For 5%, the rejection region of the null hypothesis is less than 0.05
If we fail to reject the null hypothesis, that would mean β1 is zero (in other words β1 is insignificant) and of no use in the model. Similarly, if we reject the null hypothesis, it would mean that β1 is not zero, and the line fitted is significant. We have been using only one independent feature for all this time. Let us see now how the above notations will change for the multiple linear regression models. The linear equation for a multiple regression model is as follows: 
Where k is the total number of independent features in the model. Here are the null and alternative hypotheses for the multiple linear regression model. Null Hypothesis (H0): β1= β2= β3=...= βk=0 Alternative Hypothesis (HA): β1≠0 for at least one I, where i ranges from 1 to k.Example in PythonLet us now see the implementation of the hypothesis in Python. We will use the same dataset, but this time we will consider all the independent features and one dependent feature. We must fit a multiple linear regression model to this data to predict the diabetes level. Let us take a look at the various columns of the dataset. Here we have the attribute names and the top 5 rows of independent and dependent features. Code Output: Features Names: ['age', 'sex', 'bmi', 'bp', 's1', 's2', 's3', 's4', 's5', 's6'] Independent Features: [[ 0.03807591 0.05068012 0.06169621 0.02187239 -0.0442235 -0.03482076 -0.04340085 -0.00259226 0.01990749 -0.01764613] [-0.00188202 -0.04464164 -0.05147406 -0.02632753 -0.00844872 -0.01916334 0.07441156 -0.03949338 -0.06833155 -0.09220405] [ 0.08529891 0.05068012 0.04445121 -0.00567042 -0.04559945 -0.03419447 -0.03235593 -0.00259226 0.00286131 -0.02593034] [-0.08906294 -0.04464164 -0.01159501 -0.03665608 0.01219057 0.02499059 -0.03603757 0.03430886 0.02268774 -0.00936191] [ 0.00538306 -0.04464164 -0.03638469 0.02187239 0.00393485 0.01559614 0.00814208 -0.00259226 -0.03198764 -0.04664087]] Dependent Features: [151. 75. 141. 206. 135.] This time we will use the statsmodel to fit the linear regression model. We are using this library because it has a method to display the summary statistic of the linear fit. The summary statistics include the coefficients' p-vales and the statistic value for 3 different confidence levels or significance levels. Code Output: 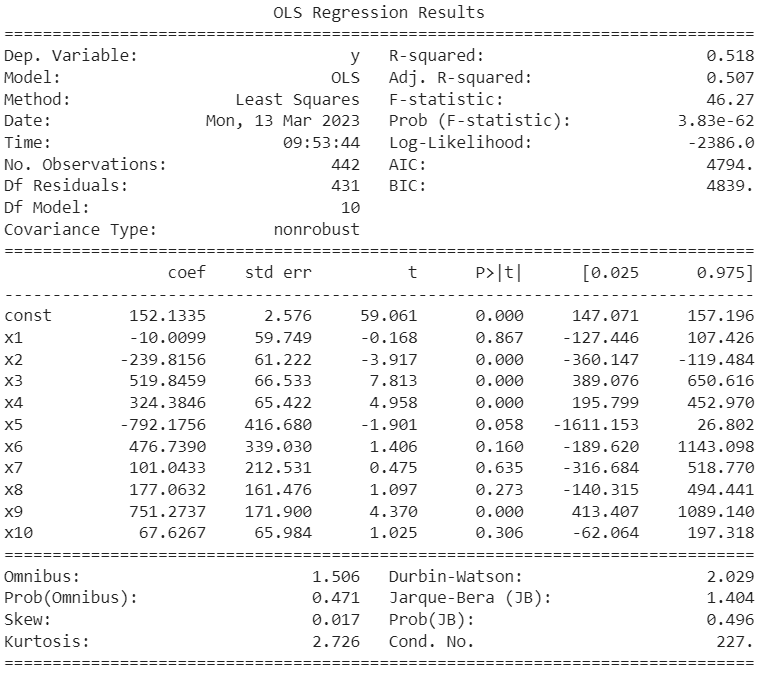
Now, look at the p-values and the t-statistic of each constant and coefficient. All those attributes whose p-value is greater than the modulus of the t-statistic are not significant to the model. The statsmodel library makes hypothesis testing simple with just one method call. From the above table, we can conclude that x1, x7, x8, and x10 are insignificant for the regression model.
Next TopicAdvanced Usage of Python
|
 For Videos Join Our Youtube Channel: Join Now
Feedback
- Send your Feedback to [email protected]
Help Others, Please Share


