| |

Calculate Moving Averages in PythonIn this tutorial, we will learn how to calculate the moving averages of time series data in Python. Moving averages is the statistical measure that refers to a set of average values obtained from the data list of fixed length. These data values are the subset of the total observations in the time series data. Let us assume that we are given a collection of time series data values of length n, and the window we must consider at any time t is of length k. Then we calculate the moving average values by taking the average of the first k data values, following k data values, and so on. The window remains of the same length throughout the array. We stop the process when the window's higher end coincides with the array's end. ExampleLet us take an example of the time series ts = [1, 2, 3, 6, 7], and we have to calculate the moving averages for a window length k = 3. We will start by calculating the average of the first three terms and store that value in the list of moving averages. This average value corresponds to exactly which data value of the array ts is another topic. Now, we will shift the window by one index such that the window starts from the second element and ends at the fourth element of the array. We will calculate the average and will add it to the list. After repeating this step, one more than the window's higher end will coincide with the end of the array. Hence, the process is complete. We will see how to implement this algorithm in Python: Code Output: Window 1: [1, 2, 3] has an average of: 2.0 Window 2: [2, 3, 6] has an average of: 3.67 Window 3: [3, 6, 8] has an average of: 5.67 The moving averages are: [2.0, 3.67, 5.67] Simple Moving AverageSMA is the most basic type of moving average. It involves the average of the given k-period values where the values will have a weight equal to 1. Analysts use the SMA to analyze or measure current or future trends. It assumes that the past and the current or the most recent observations have the same contribution in predicting the future trend. We will also see the types of moving averages that counter this assumption. Formulae of calculating SMA: 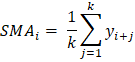
where, SMAi is the Simple Moving Average of the ith window k is the size of the window at any time t yi + j is the ith value from the set of observations having a lag of j. Method 1We will use the Numpy module of Python. The Numpy module simplifies the sum and mean of the array. We will use the sum() function to find the summation of the array elements. Code Output: The moving averages are: [2.0, 3.67, 5.67] Method 2In this method, we will use the Pandas library of Python. This library provides a simpler way to find the simple moving average of the given time series observation data. Pandas has a built method that provides a rolling window of any specified size. We thus have to use this function to get values of different windows. Then we will calculate the average of the values of each window. We will apply another Pandas function on the window-series object to calculate the mean. We cannot apply the rolling function on the Numpy array or a Python data structure. Therefore, we must convert our array to a Pandas series object to apply this function. Code Output: Raw list: [nan, nan, 2.0, 3.6666666666666665, 5.666666666666667] The final list of Simple Moving Averages: [2.0, 3.6666666666666665, 5.666666666666667] Cumulative Moving AverageAnother type of moving average is Cumulative Moving Average. To calculate CMA, we first find the cumulative sum of the times series observations. Then we take the cumulative average. This mean is used for the analysis of the time series data. Formulae: 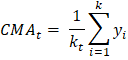
Where: CMAt is the Cumulative Moving Average at any time t Kt is the total number of observations up to the particular time t yi is the ith element of the array of the time series data Method 1We will first use Numpy to solve this problem. Numpy provides an easy way to find the cumulative sum array. We will first create a Numpy array of the sample data and, with the help of the built-in Numpy function cum_sum(), create the cumulative sum array. When we loop through each value, find the average and store it in the list of moving averages. Code Output: The cumulative sum of observations: [ 1 3 6 12 20] The Cumulative Moving Average is: [1.0, 1.5, 2.0, 3.0, 4.0] Method 2We will use the Pandas library this time. Pandas library also provides a built-in function to calculate the cumulative sum of the array of observations. Its function Series.expanding() spans over all observations with a window size of [1, length(array)]. Though it does not provide the sum, it will only return the n windows in the range[1, n] where n = length(array). We will use the Series.mean() function to find the mean of observations of each window. Code Output: The Cumulative Moving Average is: [1.0, 1.5, 2.0, 3.0, 4.0] Exponential Moving AverageAnother type of moving average is Exponential Moving Average. We calculate EMA by taking the weighted mean of the time series data. The difference between an EMA and a WMA is that the weights in EMA decrease exponentially with time. Hence it is Exponential Moving Average. This type of moving average is very fast at catching the trends. It is faster because it is slightly more sensitive to the fluctuation or changes in the observations over the course of the period we are studying. This property makes EMA efficient for short-term analysis of time series data. Formulae: 
EMAt is the exponential moving average for the observation at time t Kt is the exponential smoothing constant for the tth observation Ct is the value of the observation at time t Pt - 1 is the EMA of the time period t - 1 Method 1We will solve this problem by writing our own algorithm to find the EMA of a given time series. Code Output: The EMA values are: [1, 1.28, 1.76, 2.95, 4.36] Method 2We will use the Pandas library to calculate the EMA in this example. The Pandas library provides a built-in method Series.ewm(com). This method is designed to find a Pandas Series of the exponentially weighted windows out of the given Series of data. We have to give a com value to the function. According to the formula above, K = 1 / (1 + com). This way, the weights will be calculated by the function and multiplied by the time series data to which we have attached the function. The value of K always lies between 0 and 1. Code Output: The list of Exponential Moving Averages: [1.0, 1.5833333333333333, 2.220183486238532, 3.6801801801801797, 5.196316328022218] Weighted Moving Average (WMA)Some analysts argue that the most recent values add more importance to measuring a trend through a time series than the older data. Thus they created Weighted Moving Average. The calculation of WMA is almost the same as SMA. The main difference is that the data will be multiplied with the pre-defined weights here. The weights should follow some conditions:
Formulae of calculating WMA: 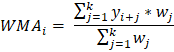
Where, WMAi is the Weighted Moving Average of the ith window k is the size of the window at any time t yi + jis the ith value from the set of observations having a lag of j. wj is the weight of the jth observation of the window Method 1We will first use the Numpy module of Python. We will use the same logic as we used to calculate SMA. The difference is that we will simultaneously loop through the weights array and, leveraging the elementwise multiplication of Numpy arrays, multiply the data to the weights. Then we will find the sum of the multiplied series and the sum of the current window of weights. On dividing these two numbers, we will get the weighted mean of the current window. Code Output: The weighted moving averages: [2.33, 4.11, 6.08] Method 2In this method, we will use the Pandas library of Python. This library provides a simpler way to find the simple moving average of the given time series observation data. Pandas has a built method that provides a rolling window of any specified size. We thus have to use this function to get values of different windows. Then we will calculate the average of the values of each window. We will apply another Pandas function on the window-series object to calculate the mean. We cannot apply the rolling function on the Numpy array or a Python data structure. Therefore, we need to convert our array to a Pandas series object to apply this function. Code Output: Raw list: [nan, nan, 2.0, 3.6666666666666665, 5.666666666666667] The final list of Simple Moving Averages: [2.0, 3.6666666666666665, 5.666666666666667] ApplicationsTime-Series Analysis: It smooths out short-term variation and highlights long-term observations such as trends and cycles. Financial Analysis: It is used in financial analysis of stock markets, like the calculation of stock prices and returns and analyzing trends of the market. Environmental Engineering: It is used in analyzing environmental conditions by considering various factors such as the concentration of pollutants, etc. Computer Performance Analysis: It is used to analyze computer performance by calculating metrics such as average CPU utilization, process queue length, etc.
Next TopicExponential Moving Average in Python
|
 For Videos Join Our Youtube Channel: Join Now
Feedback
- Send your Feedback to [email protected]
Help Others, Please Share


