| |
Python Tutorial
Python OOPs
Python MySQL
Python MongoDB
Python SQLite
Python Questions
Plotly
Python Tkinter (GUI)
Python Web Blocker
Python MCQ
Related Tutorials
Python Programs

3D Visualisation of Quick Sort using Matplotlib in PythonA popular and effective sorting algorithm called Quick Sort uses a divide-and-conquer approach to organize the items in a list or array. Although Quick Sort is commonly implemented as a text-based algorithm, you may use Python's Matplotlib to visualize the method in three dimensions to better understand how it functions. This visualization adds a third dimension to the conventional two-dimensional representations of the sorting process by allowing you to visualize it in three dimensions. An overview of how to do this is provided below: By examining and comparing the number of operations required to compare and swap the pieces, visualizing algorithms helps one better comprehend them. Since 3D algorithm visualization is less frequent, we'll use Matplotlib to plot bar graphs and animate them to represent the array's members. Data Representation: Create a 3D scatter plot to first depict your list or array. Each data point is a 3D coordinate, with the x-axis denoting the element's index, the y-axis denoting its value, and the z-axis initially set to a fixed value (for example, zero). Partitioning: The primary operation of Quick Sort is partitioning, which involves choosing a pivot element and moving the other elements so that all of those smaller than the pivot are on one side and all of those larger than the pivot are on the other. Moving the pivot element up and down the y-axis as the data points are moved along the x-axis allows you to animate this process in your 3D visualization. Recursion: Recursive algorithms are used in Quick Sort. Each recursive call that the algorithm makes can be visualized in your visualization as a separate 3D scatter plot as the program continues. This makes it easier to understand how the algorithm divides the problem into smaller problems. Let's look at the Quick Sort 3D Visualisations: Approach:
ImplementationOutput: enter array size: 5 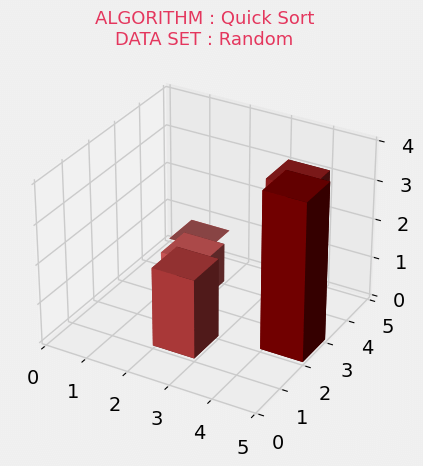
|
 For Videos Join Our Youtube Channel: Join Now
Feedback
- Send your Feedback to [email protected]
Help Others, Please Share


