| |

Time Series Forecasting with Prophet in PythonTime Series forecasting is considered a challenging task as there are various methods that we could utilize and various hyperparameters for each method. The Prophet library is an open-source library designed to make forecasts for univariate datasets of time series. It is easy to use and developed to automatically find a good set of hyperparameters for the model to make skillful forecasts for data with the help of trends and seasonal structure by default. In the following tutorial, we will discuss the use of the Facebook Prophet Library in order to forecast time series. Throughout the tutorial, we will learn:
So, let's get begun. Understanding the Prophet Forecasting LibraryProphet, also known as "Facebook Prophet", is an open-source library to forecast one variable (univariate) time series designed by Facebook. Prophet implements what they refer to as an additive time series forecasting model, and the implementation supports seasonality, trends, and holidays. As per the documentation of Prophet Package, it implements a procedure to forecast time series data on the basis of an additive model where non-linear trends are fit with daily, weekly, yearly seasonality, in addition to the holiday effects. It is designed as easy to use and entirely automatic. For instance, point it at a time series and get a forecast. It is intended for internal company utilization, such as forecasting sales, capacity, and a lot more. The Prophet library offers two interfaces, involving Python and R. We will mainly focus on the Python interface for this tutorial. The primary step is to install the Prophet library with the help of the pip installer. How to Install the Python Prophet library?In order to install the Python module, we need 'pip', a framework to manage packages required to install the modules from the trusted public repositories. Once we have 'pip', we can install the prophet library using the command from a Windows command prompt (CMD) or terminal as shown below: Syntax: Verifying the InstallationOnce the module is installed, we can verify it by creating an empty Python program file and writing an import statement as follows: File: verify.py Now, save the above file and execute it using the following command in a terminal: Syntax: Output: Prophet 0.7.1 If the above Python program file does not raise any exception and return the installer version number, the Prophet library is installed properly. However, in the case where an exception is raised, try reinstalling the library, and it is also recommended to refer to the official documentation of the library. Understanding the working of the Prophet libraryLet us now understand the working of the Python Prophet Library using the Dataset of monthly car sales. This Dataset is a standard univariate time series dataset consisting of both a trend as well as seasonality. The Dataset contains 108 months of data, and a naïve persistence forecast can accomplish a mean absolute error of around 3,235 sales, offering a lower error limit. Let us begin by loading and summarizing the Dataset Loading and Summarizing DatasetThe prophet needs data to be stored in the form of Pandas Data frames. Thus, we will load and summarize the data with the help of the Pandas library. We can load the data directly from the URL by calling the Pandas read_csv() function, summarizing the shape (number of rows and columns) of the data, and looking at the first few rows of the data. Let us consider the following example demonstrating the same: Example: Output:
(108, 2)
     Month    Sales
0  1960-01   6550.0
1  1960-02   8728.0
2  1960-03  12026.0
3  1960-04  14395.0
4  1960-05  14587.0
Explanation: We have imported the read_csv() function from the Pandas library in the above snippet of code. We have then initialized the path where the data as a CSV file is stored and used the imported function to read that file and convert it into a Data frame. We have then summarized the shape of the data using the shape attribute. At last, we have printed the first few rows of data for the users. As a result, we can observe that there is 108 months' worth of data and two columns. The first column is the month and the second is the number of sales. Note: The first column in the output is a row index and is not a part of the dataset, just a helpful utility that Pandas uses to order rows.Loading and Plotting DatasetA time-series dataset is incomplete until we plot it. Plotting a Time series allows us to show if there is a trend, a seasonal cycle, outliers, and many more. It gives us a feel for the data. We can plot the data easily in Pandas by calling the plot() function on the Data frame. Let us consider the following example illustrating the same: Example: Output: 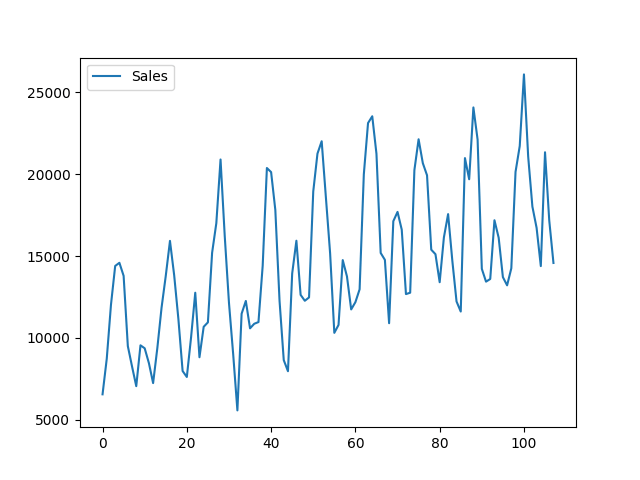
Explanation: In the above snippet of code, we have imported the read_csv function along with the pyplot module from their respective libraries. We have then initialized the path of the CSV file. We have then used the read_csv function to read that file and convert it into a data frame. We have then used the plot() function to plot the graph and the show() function to display it for the users. As a result, we can clearly view the trend in sales over time and a monthly seasonal pattern to the sales. These are patterns we expect the forecast model to consider. Now that we are familiar with the dataset, let us explore how we can utilize the Prophet library to make forecasts. Forecasting car sales using Prophet in PythonIn the following section, we will discuss how to use the Prophet library to forecast the car sales dataset. Let us begin by fitting a model on the dataset. Fitting Prophet ModelIn order to use Prophet for forecasting, we will first define a Prophet() object and configure it. We will then call the fit() function and pass the data to fit it on the dataset. The Prophet() object accepts parameters to configure the model type according to preferences, like the growth type, the seasonality type, and more. By default, the model will work hard to figure out almost everything automatically. The fit() function accepts a Data frame of Time Series data. The data frame should have a particular format. The name of the first column must be 'ds' and consists of the date times. The name of the second column must be 'y' and consists of the observations. This statement implies that we change the names of the columns in the dataset. It also wants that the first column be converted to date-time objects if they are not already. For example, this can be done by loading the dataset using the appropriate parameters to the read_csv() function. Now, let us consider the following syntax illustrating how we can modify the loaded dataset to have an expected structure. Example: Explanation: In the above syntax, we have altered the name of the data frame columns to have an expected structure. Now, let us see the complete example of fitting a Prophet model on the dataset of the car sales as follows: Example: Output: INFO:fbprophet:Disabling weekly seasonality. Run prophet with weekly_seasonality=True to override this. INFO:fbprophet:Disabling daily seasonality. Run prophet with daily_seasonality=True to override this. Explanation: We have imported the required libraries and loaded the data in the above snippet of code. We have then prepared the expected names of the columns. At last, we have defined the prophet model and fit the dataset to it. The next step is to make a forecast. Making an in-sample ForecastIt will help make a forecast on historical data. We can make a forecast on data utilized as input to train the model. Ideally, the model has seen the data before and would make a proper prediction. However, this is not the scenario as the model attempts to generalize across all cases in the data. This process is known as making an in-sample (in training set sample) forecast and reviewing the outputs can provide insight into how good the model is. That is, how well it learned the training data. A forecast is made by calling the predict() function and passing a data frame consisting of one column named 'ds' and rows with date-times for predicted intervals. There are various ways to create this "the_forecast" data frame. For example, the last twelve months in the dataset, create a string for every month. In the following case, we will loop over one year of dates. We will then convert the list of dates into a data frame and transform the values of the string into datetime objects. Let us consider the following syntax demonstrating the same. Example: Explanation: In the above snippet of code, we have defined a list as future. We have then used the for-loop for iterating through the months of 1968 and returned the data of that period. We have then framed this data into a data frame with the column name 'ds' and set this column to display date-time. We can now provide the data frame to the predict() function in order to evaluate the forecast. The consequence of the predict() function will be a data frame consisting of multiple columns. Perhaps the most important columns are:
Let us consider the following snippet of code where we have printed the first few predictions: Example: Explanation: In the above snippet of code, we have printed the imported columns of the first few predictions. Prophet also offers an in-built utility to visualize the prediction in the context of the training dataset. This can be accomplished using the plot() function on the model and passing it a resulted data frame. It will create a plot of the training dataset and overlay the prediction with the upper and lower bounds for the forecast dates. Here is the syntax for the same: Example: Explanation: In the above snippet of code, we have used the plot() function on the model and passed it a result data frame. We have then used the show() function to display the resulting graph. Now, let us see the complete program of making an in-sample forecast. Example: Output:
INFO:fbprophet:Disabling weekly seasonality. Run prophet with weekly_seasonality=True to override this.
INFO:fbprophet:Disabling daily seasonality. Run prophet with daily_seasonality=True to override this.
ds yhat yhat_lower yhat_upper
0 1968-01-01 14334.737769 12802.203888 15949.723255
1 1968-02-01 14905.955964 13337.420778 16552.309312
2 1968-03-01 20842.150502 19242.348853 22460.757530
3 1968-04-01 22870.095215 21341.988780 24473.330178
4 1968-05-01 24176.211162 22508.496756 25726.410744
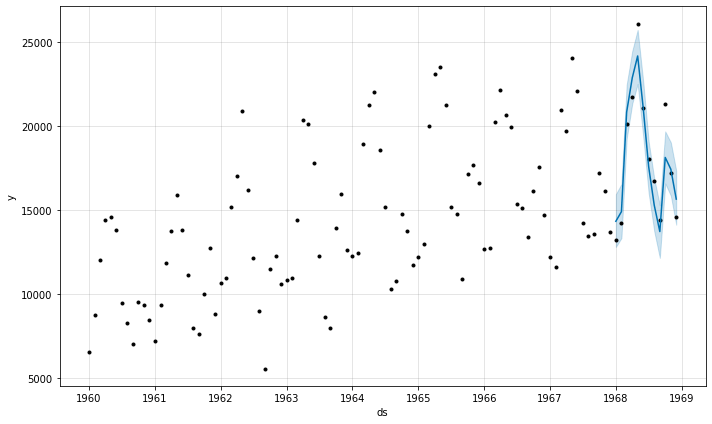
Explanation: As we can observe, the above snippet of code will return the forecast of the last 12 months of the dataset. The first five months of the prediction are reported, and we can also observe that the values are not too varied from the original sales values in the dataset. Moreover, we can also notice that a plot has been created. The training data are represented as black dots, and the forecast is a blue line with upper and lower bounds in a blue shaded region. At last, we can understand that the forecasted 12 months is a good match for the real observations, specifically when the bounds are considered.
Next TopicPython Pexpect Module
|
 For Videos Join Our Youtube Channel: Join Now
Feedback
- Send your Feedback to [email protected]
Help Others, Please Share


