| |
Python Tutorial
Python OOPs
Python MySQL
Python MongoDB
Python SQLite
Python Questions
Plotly
Python Tkinter (GUI)
Python Web Blocker
Python MCQ
Related Tutorials
Python Programs

Matplotlib - Axes ClassIntroductionThe popular Python module Matplotlib is used to produce a variety of data visualizations. The Axes class in Matplotlib is crucial to the charting process. The Axes object can be considered a canvas or a specific subplot inside a figure where you can display your data. 1. Creating an Axes Object You normally start by making a Matplotlib figure before utilising the Axes class. The plt.subplots() technique will allow you to do this. This method returns a plotting area representation as an Axes object and a figure. For instance, In this illustration, fig is the figure that houses your plot, and the axe is the Axes object where you may customise the plot by adding your data. 2. Plotting Data Once you have an Axes object, you may visualize your data using one of its many charting methods. For various sorts of graphs, Matplotlib offers functions like plot(), scatter(), bar(), and others. 3. Customizing the Axes You can change the labels, titles, axis limits, and other properties to change how the Axes object looks 4. Multiple Axes To construct subplots in more complicated visualizations, you can create numerous Axes objects inside of a single figure 5. Grids and Legends You can improve your plot by including grid lines and legends in your Axes object. This helps improve the informational value of your visualizations 6. Custom Plot Styles You can change the colours, line styles, markers, and other plot elements by supplying parameters to the plotting functions. 7. Other Features The Axes class in Matplotlib provides extra features like axis type selection (e.g., linear, logarithmic), text annotations, and appearance settings for the plot. 8. Saving and Displaying the Plot When your plot is prepared, you can use the savefig() function to save it to a file or the show() function to display it in your Python environment. Example - 1Output: 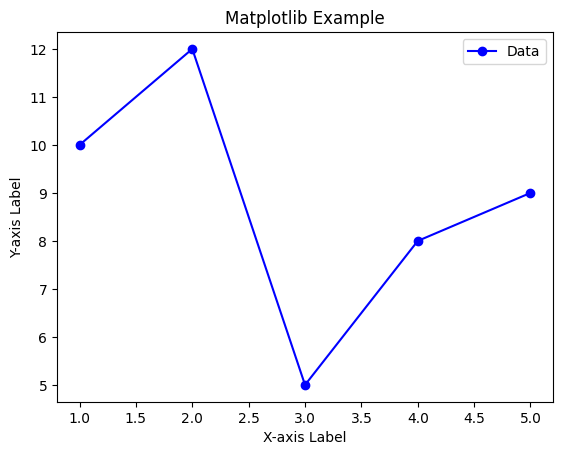
Example - 2Output: 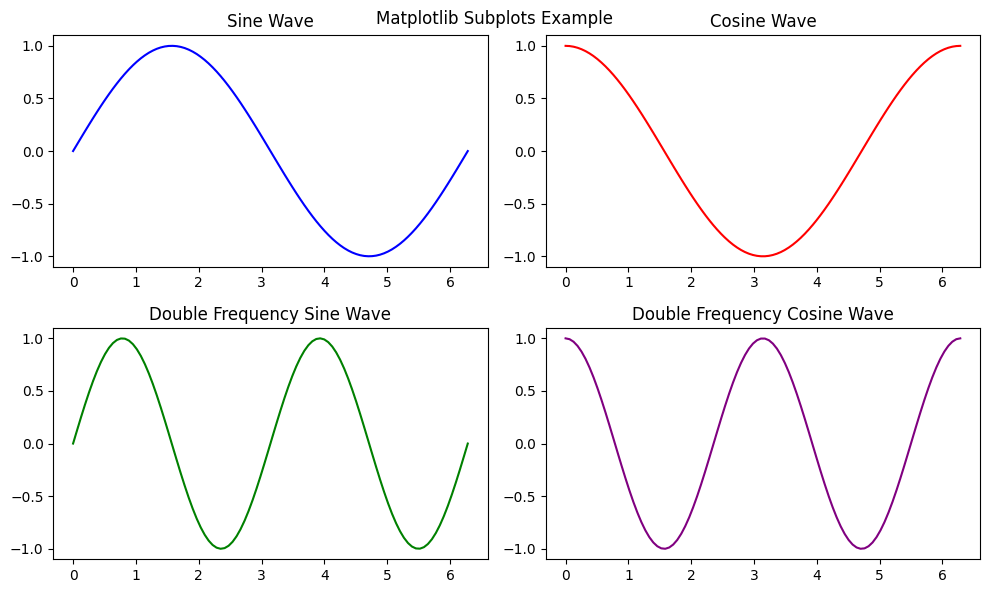
Axes ClassHierarchical Structure Matplotlib's charting functions adhere to a hierarchical structure. You have the Figure object, which can contain one or more Axes objects at the top level. Each Axes item in the illustration corresponds to a distinct plot or subplot. Thanks to this hierarchy, you can construct intricate figures using numerous plots or visualizations. Styling and customization The Axes class gives a wide range of customization possibilities. Axis labels, titles, limitations, ticks, and other options are available. The plot's lines, markers, colours, and typefaces can also be altered to meet your individual needs. Subplots You can present numerous plots in a single figure by using subplots. Each subplot can have its own Axes object, and you can arrange them in rows and columns. This is useful when comparing various datasets or visualizing various elements of your data side by side. Text and Annotations The Axes class allows you to annotate your plots with text and draw arrows. These elements can draw attention to crucial data points, offer explanations, or give your visualizations more context. ConclusionThe Axes class from Matplotlib is a key element that enables users to build flexible and individualized data visualizations in Python. This class, tucked away in the larger Matplotlib library, offers a hierarchical method of organizing plots within a figure and an organized approach to charting data. You can quickly generate and modify various plot types with Axes, from straightforward line charts to intricate multi-subplot visualizations. Because of its adaptability, you can customize the labels, titles, axis limitations, and style of your visualizations to make sure they successfully express the message you want them to. Axes can adapt to various data properties by supporting logarithmic and other scale types. The capacity to give context and engage the audience is improved through annotations, text, and interactive elements.
Next TopicMultivariate Linear Regression in Python
|
 For Videos Join Our Youtube Channel: Join Now
Feedback
- Send your Feedback to [email protected]
Help Others, Please Share


