| |
Python Tutorial
Python OOPs
Python MySQL
Python MongoDB
Python SQLite
Python Questions
Plotly
Python Tkinter (GUI)
Python Web Blocker
Python MCQ
Related Tutorials
Python Programs

Using Matplotlib with Jupyter NotebookJupyter NotebookThe Jupyter Notebook is an open-source web application that you can use to make and share records that contain live code, conditions, perceptions, and text. Jupyter Notebook is kept up with by individuals at Venture Jupyter. Jupyter Notebook are a side project from the IPython project, which used to have an IPython Note pad project itself. The name, Jupyter, comes from the centre upheld programming dialects that it upholds: Julia, Python, and R. Jupyter ships with the IPython bit, which permits you to compose your projects in Python, however there are presently north of 100 different portions that you can likewise utilize. The Jupyter Notebook is excluded with Python, so if you need to give it a shot, you should introduce Jupyter. There are numerous conveyances of the Python language. This article will zero in on only two of them for the reasons for introducing Jupyter Note pad. The most well-known is CPython, which is the reference adaptation of Python that you can get from their site. It is likewise accepted that you are utilizing Python 3. MatplotlibThe Jupyter Notebook is an open-source web application that permits you to make and share records that contain live code, conditions, representations and account message. Utilizes incorporate information cleaning and change, mathematical reproduction, measurable demonstrating, information perception, AI, and significantly more. Matplotlib is one of the most famous Python bundles utilized for information representation. It is a cross-stage library for causing 2D plots from information in arrays. To get everything rolling you simply have to make the essential imports, set up certain information, and you can begin plotting with the assistance of the plot() function. When you're finished, make sure to show your plot utilizing the show() capability. Matplotlib is written in Python and utilizes NumPy, the mathematical science expansion of Python. It comprises of a few plots like:
InstallationAssuming this is the case, then you can utilize a helpful instrument that accompanies Python called pip to introduce Jupyter Journal like this: The following most famous circulation of Python is Anaconda. Anaconda has its own installer device called conda that you could use for introducing an outsider bundle. Be that as it may, Anaconda accompanies numerous logical libraries preinstalled, including the Jupyter Scratch pad, so you don't really have to do something besides introduce Anaconda itself. Install Matplotlib with pip Matplotlib can likewise be introduced utilizing the Python bundle administrator, pip. To introduce Matplotlib with pip, open a terminal window and type: Introduce Matplotlib with the Anaconda Brief Matplotlib can be introduced utilizing with the Anaconda Brief. Assuming the Anaconda Brief is accessible on your machine, it can for the most part be found in the Windows Start Menu. To introduce Matplotlib, open the Anaconda Brief and type: Using Matplotlib with Jupyter Notebook:Matplotlib is a Python library that is utilized frequently with Jupyter Scratch pad. The module in matplotlib that is utilized is called pyplot. In this instructional exercise, we'll become familiar with a smidgen about matplotlib and how to involve it in Jupyter Note pad. Matplotlib.pyplot gives a MATLAB-like approach to plotting. This implies that pyplot has many capabilities to make changes to a figure. Matplotlib in blend with Jupyter Scratch pad is a famous method for envisioning information involving Python for a wide range of utilizations in science, innovation, and training. After the installation is completed. We should begin utilizing Matplotlib with Jupyter Note pad. We will plot different charts in the Jupyter Note pad utilizing Matplotlib. Example: Line Plot: Output: 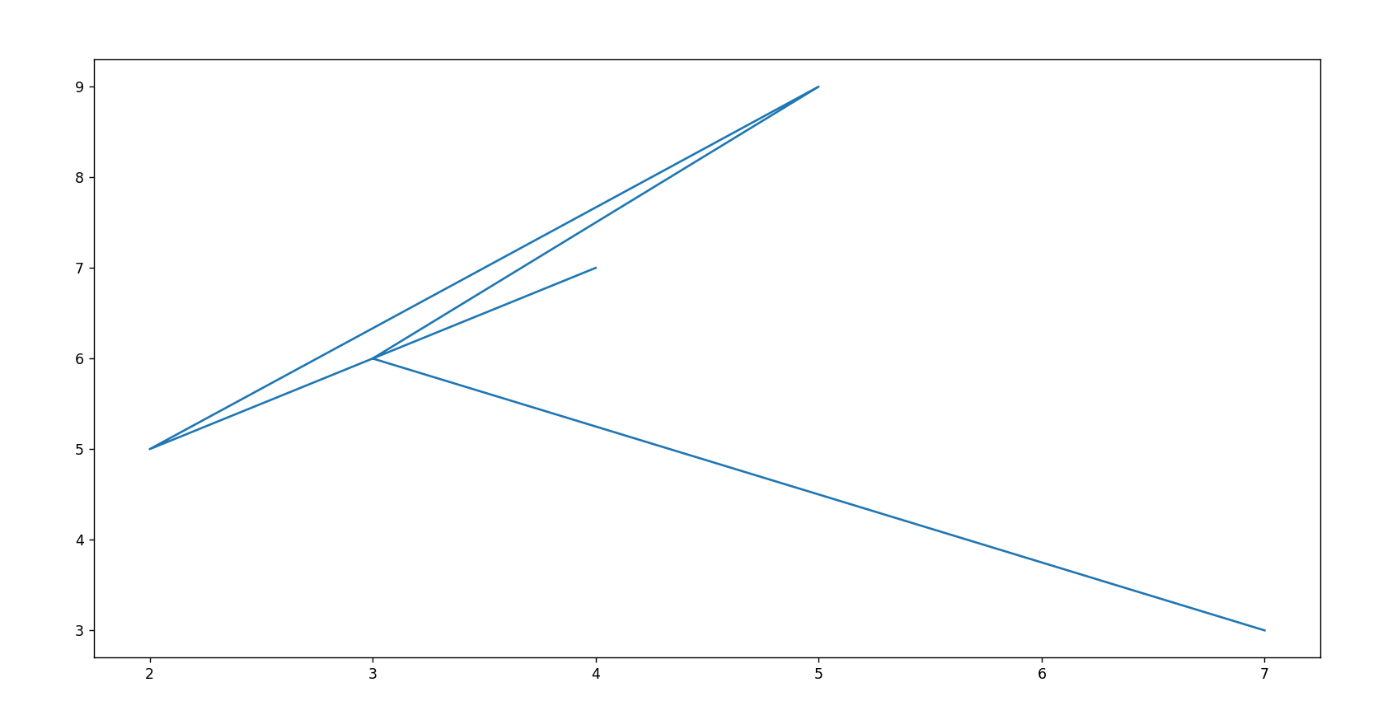
Example 1: Bar Plot: Output: 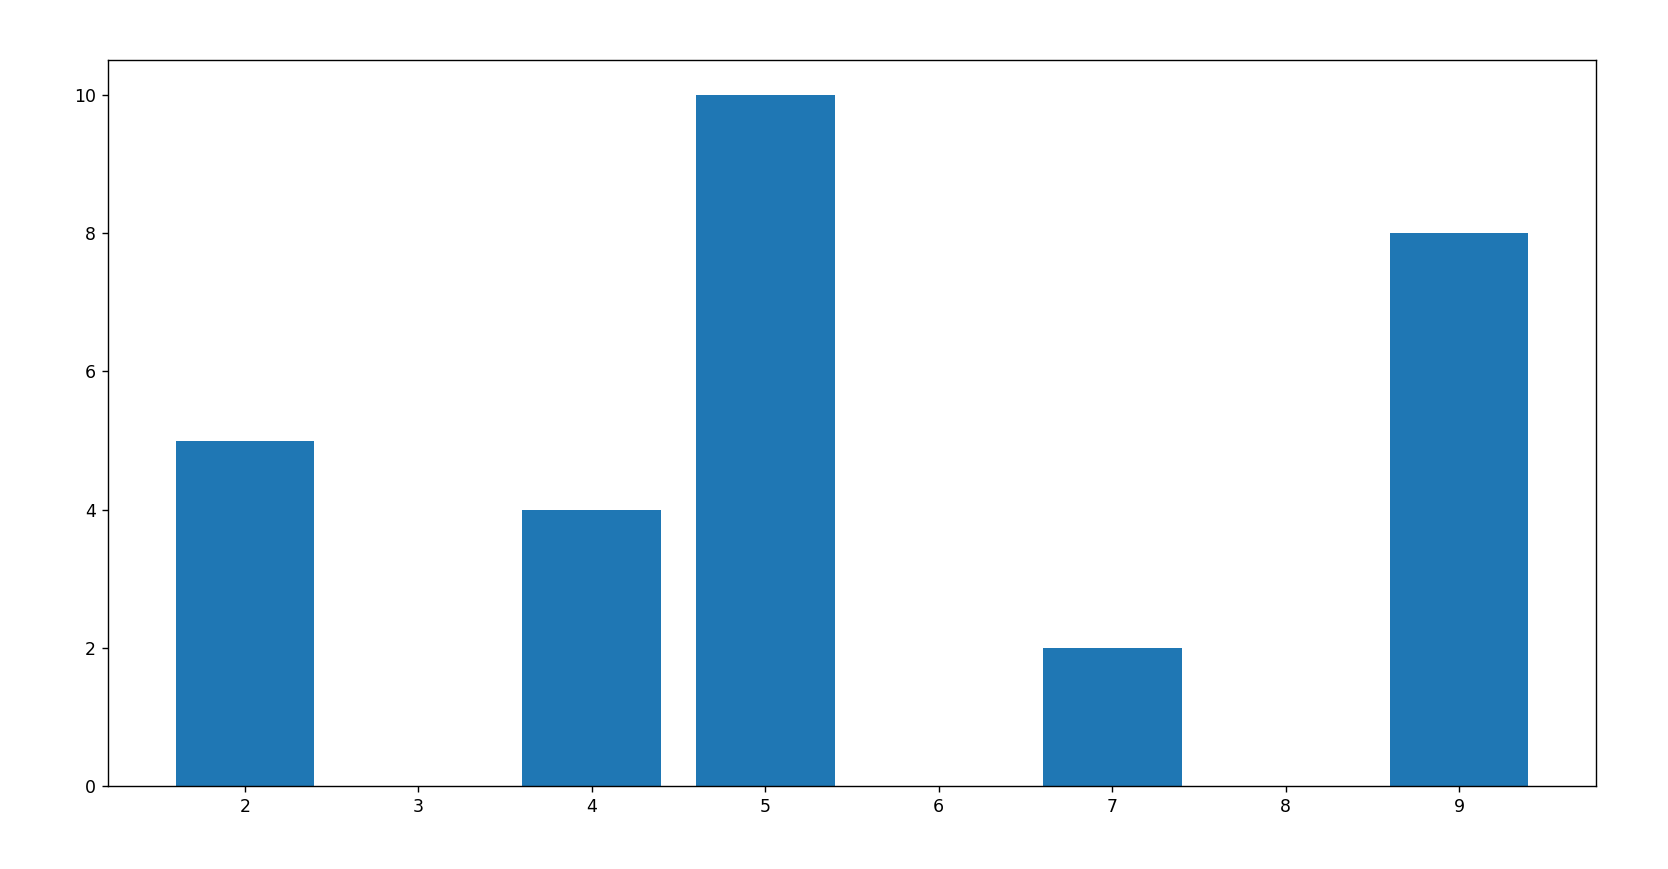
Example 2: Histogram: Output: 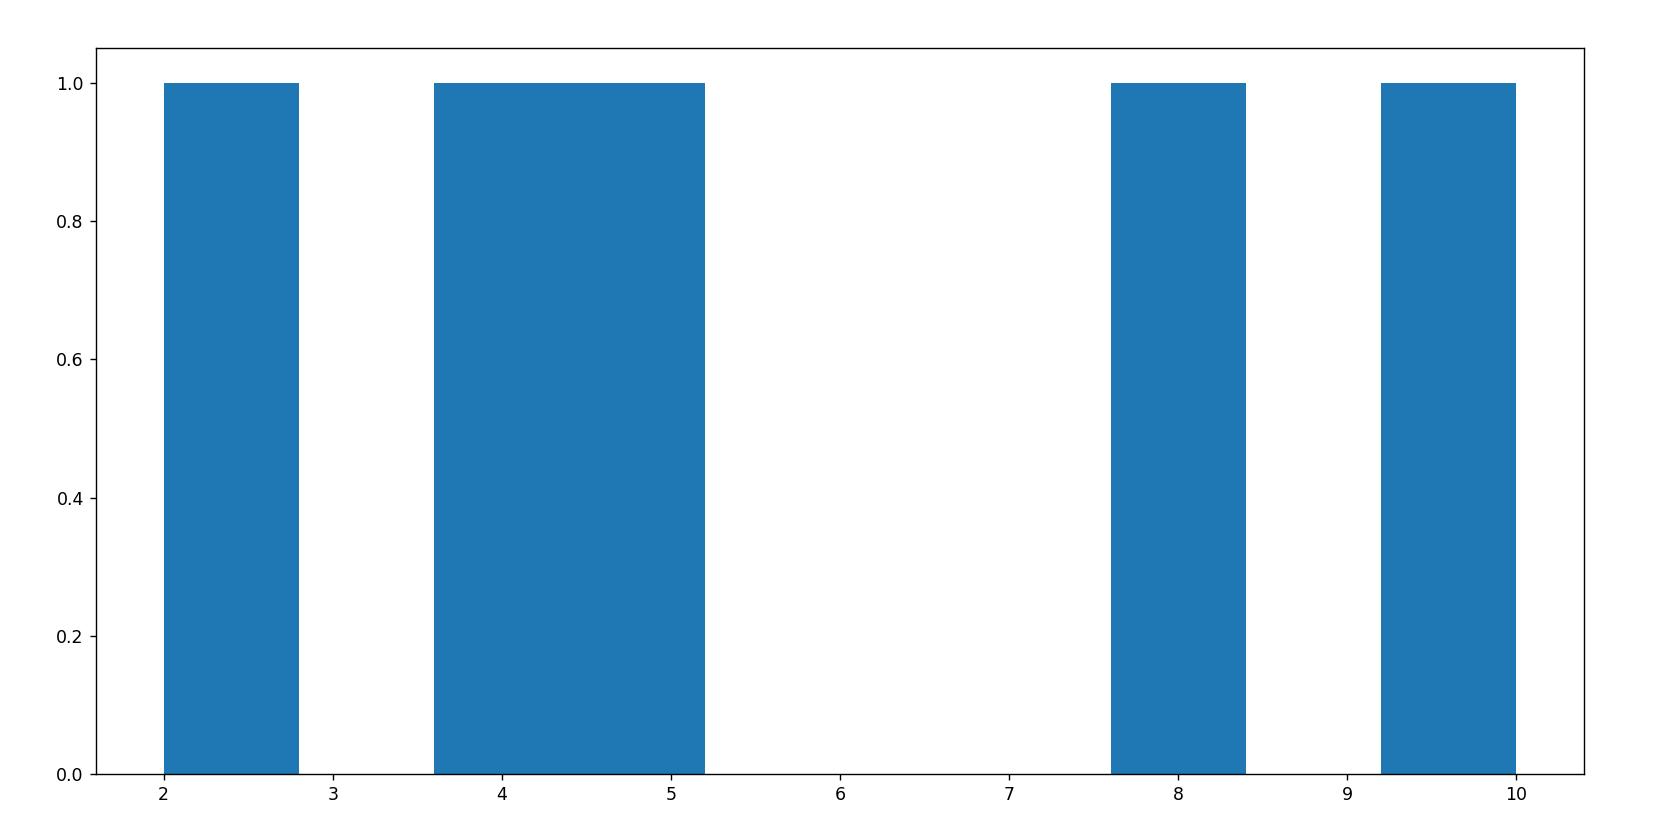
Example 3: Scatter Plot: Output: 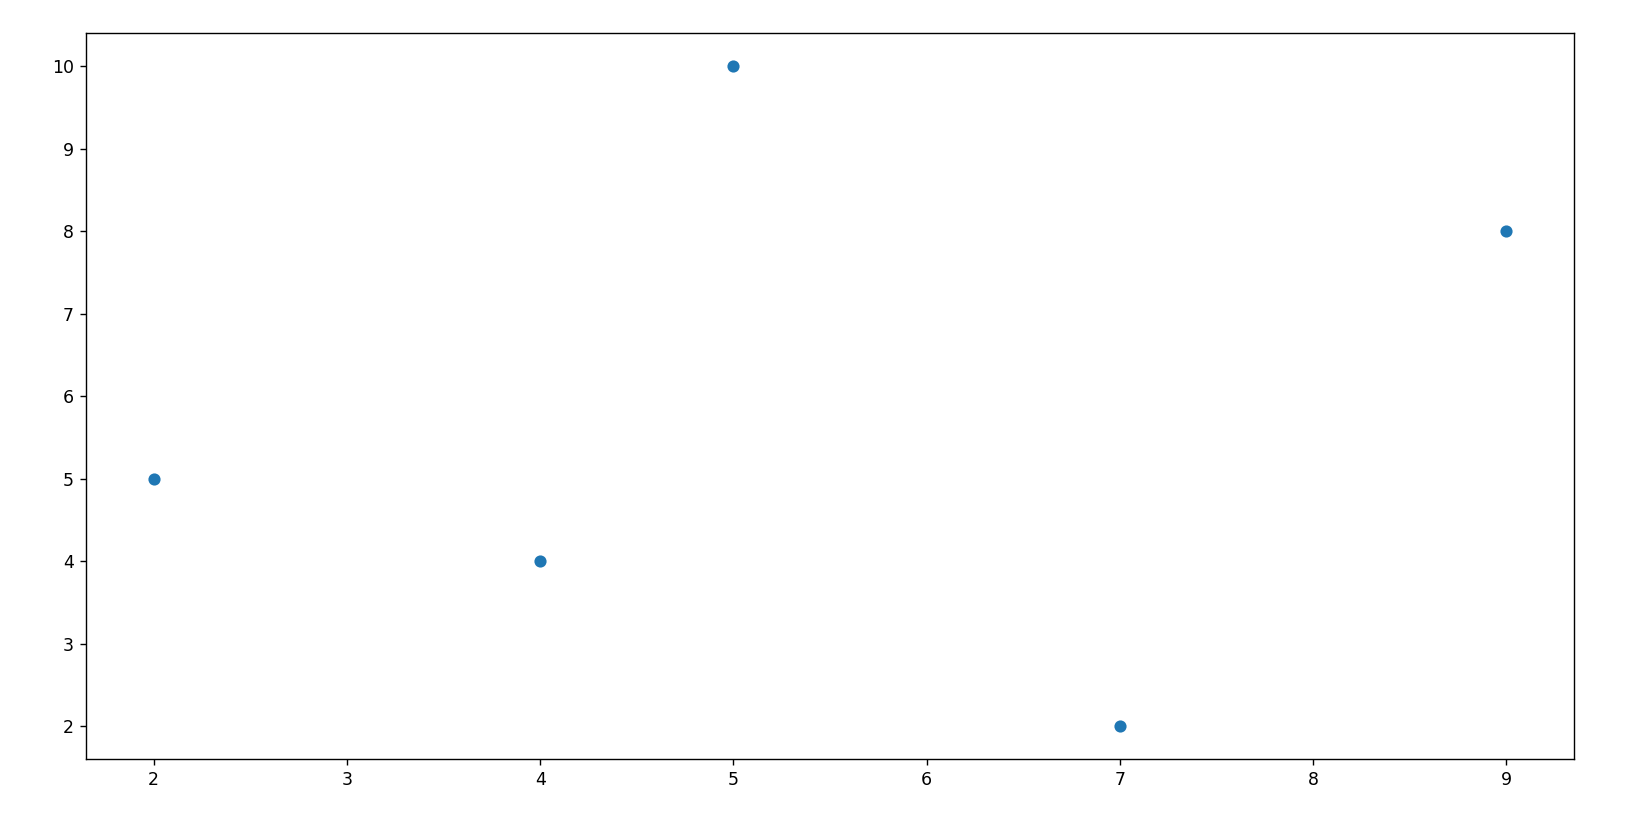
Adding Title and Labelling the Axis in the graph:We can add title to the graph by using the following command We can label the x-axis and the y-axis by using the following functions Example 4: Output: 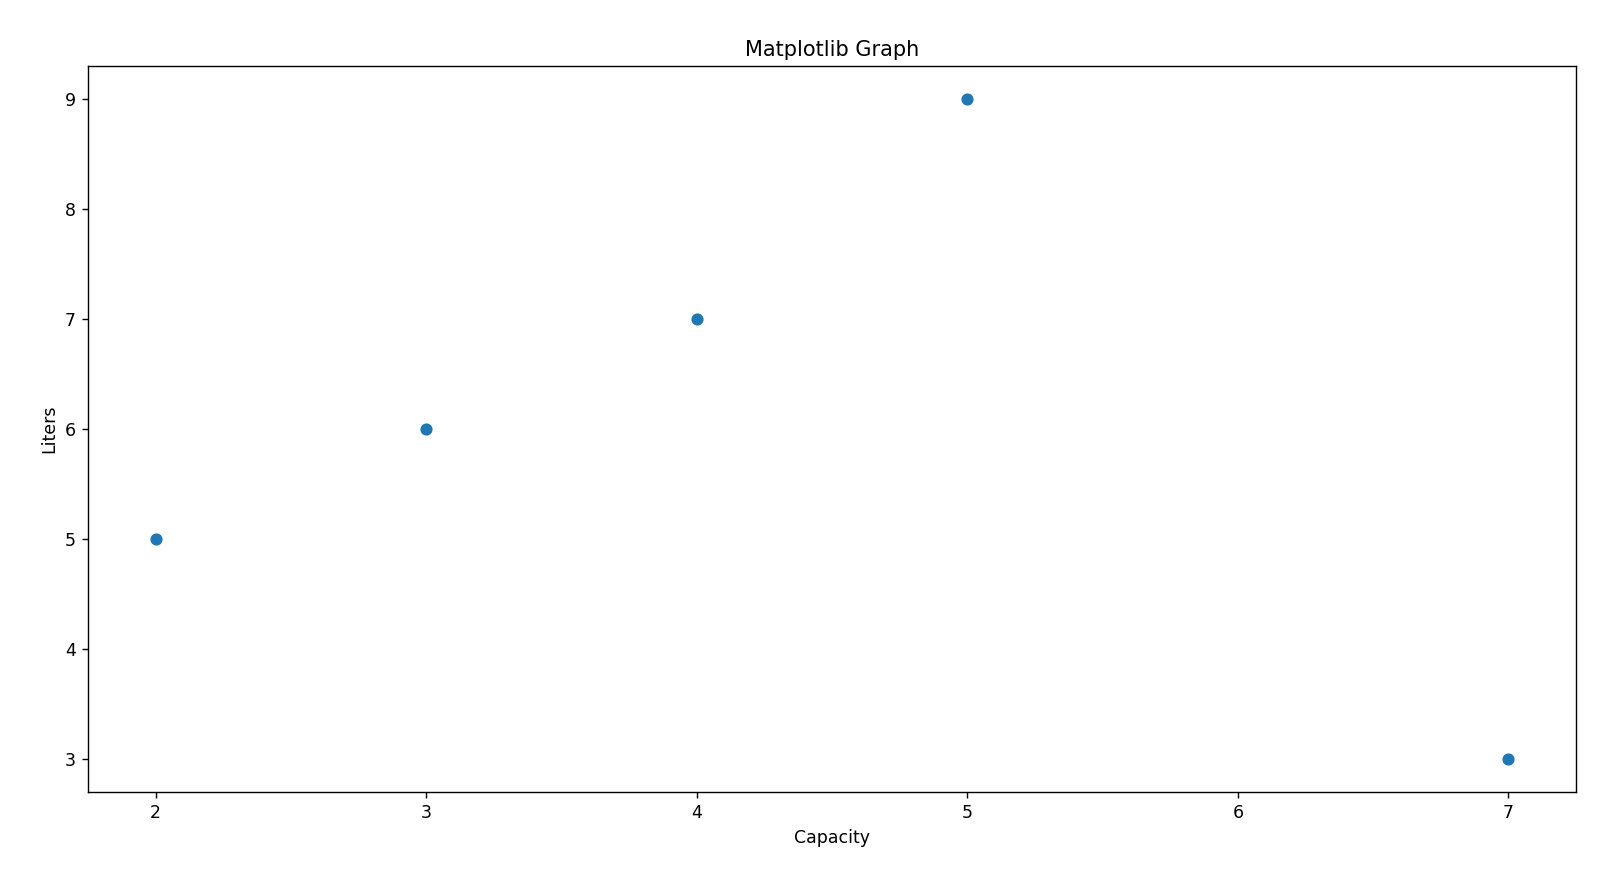
We can likewise compose a program in similar cell for printing Various Diagrams together. We can print these charts upward one underneath one more by rehashing the show() capability in the program or we can utilize a capability called subplot() to print them evenly too. Example 5: Output: 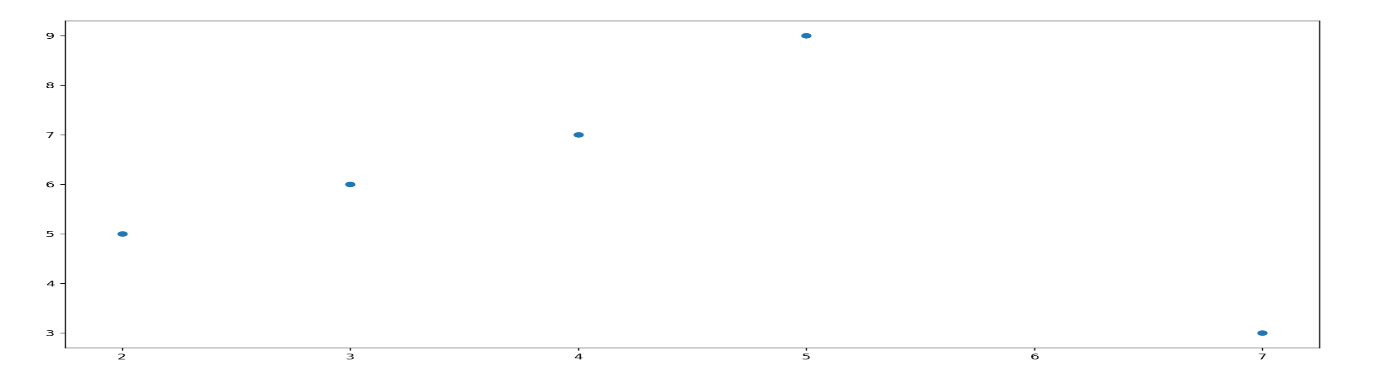
As we can see that the above program can give both outputs as Scatter graph and plot graph. |
 For Videos Join Our Youtube Channel: Join Now
Feedback
- Send your Feedback to [email protected]
Help Others, Please Share


