| |
Python Tutorial
Python OOPs
Python MySQL
Python MongoDB
Python SQLite
Python Questions
Plotly
Python Tkinter (GUI)
Python Web Blocker
Python MCQ
Related Tutorials
Python Programs

Python GraphvizWhat is Graphviz?Graphviz is open-source chart perception programming. Chart perception is an approach to addressing underlying data as outlines of conceptual diagrams and organizations. It has significant applications in systems administration, bioinformatics, programming, data set and website composition, AI, and visual connection points for other specialized areas. HighlightsThe Graphviz design programs take portrayals of charts in a basic text language and make outlines in valuable configurations, for example, pictures and SVG for site pages; PDF or Postscript for consideration in different reports; or show in an intuitive diagram program. Graphviz has numerous valuable elements for substantial charts, for example, choices for colors, textual styles, even hub designs, line styles, hyperlinks, and custom shapes. Software architectureGraphviz consists of a graph description language named the DOT language and a set of tools that can generate and/or process DOT files:
Outstanding utilizations of Graphviz include:
Graphviz ExamplesSketchviz utilizes Graphviz, which deciphers depictions of diagrams written in the DOT language into pictures. You can click any picture to send off an intelligent manager of that chart. The authority documentation is an incredible reference; however an unfortunate device for novices. All things being equal, we've composed this Graphviz instructional exercise that gives a prologue to its most helpful highlights. The BasicsA chart is an assortment of hubs and edges. You can make edges between hubs with the - - or - > administrator. Naturally, a hub's mark is its name. Example: You can have a graph that uses --: Example: Or a digraph, which uses ->: Output: 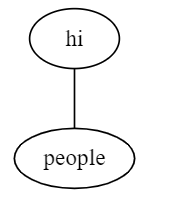
The show can be altered by determining credits. Credits for the chart, in general, come at the highest point of the diagram statement, while ascribes for hubs and edges come in square sections following they are pronounced. Example: 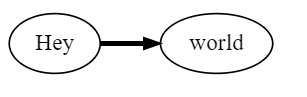
Graphviz itself upholds any text style, yet for our facilitated diagrams to work, you'll have to adhere to one of these three text styles:
Example: 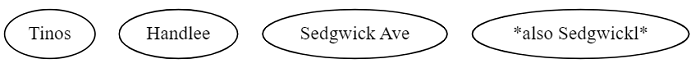
You can provide defaults for nodes and edges to avoid repeating yourself: 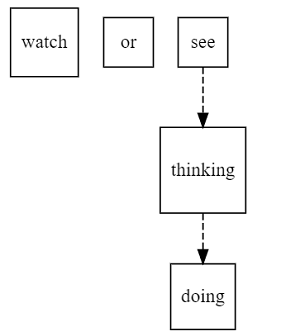
Advanced GraphsCongrats, you currently know to the point of making helpful diagrams! These next stunts can prove useful; however, don't feel like you want to learn them promptly. Records Hubs with shape=record are dealt with exceptionally. Note that you want to utilize ports, implied by <angle-brackets> to make edges to and from records. These help show tables and item designs. Example: Output: 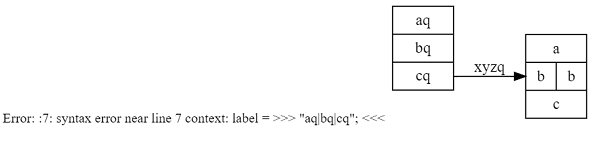
Clusters (or Subgraphs)You can group related nodes by putting them in a subgraph whose name begins with cluster_. Example: Yuck, that didn't spread out pleasantly! We'll add constraint=false to the edge among expressjs and awss-sdk to tell Graphviz that the edge doesn't suggest that expressjs ought to be positioned higher in priority: 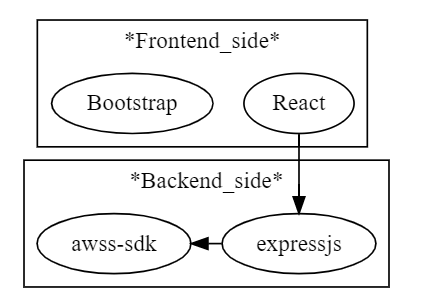
Example: Clusters can also be nested: Output: 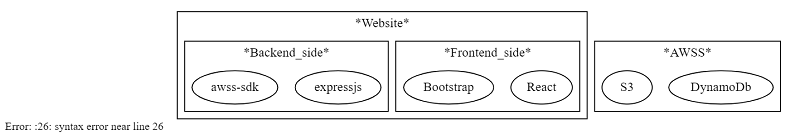
In the event that you'd like your bolt to begin or stop at the group limit, you need to set compound=true and utilize the lhead or ltail ascribes on edge: Example: Output: 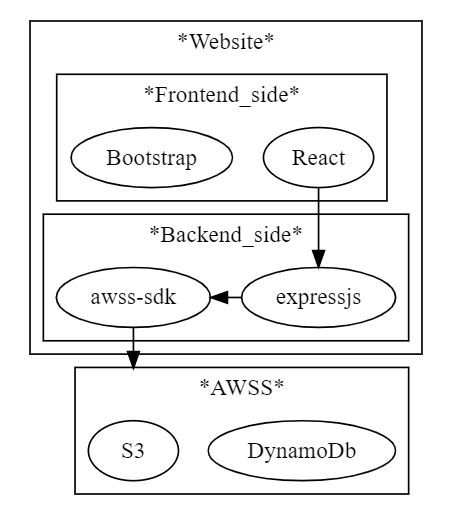
|
 For Videos Join Our Youtube Channel: Join Now
Feedback
- Send your Feedback to [email protected]
Help Others, Please Share


