How to Plot Multiple Lines on a Graph Using Bokeh in Python
Bokeh is a library of Python used for data visualization, and it develops its plots using JavaScript and HTML platforms. And it also targets modern website browsers to provide presentation elegant, concise construction of novel graphics good high-performance interactivity.
In this tutorial, we will learn how to plot multiple lines on a graph using the bokeh library. For this, we will be using the multi_line() function of the bokeh.plotting module.
plotting.figure.multi_line()
Syntax:
The syntax for multi_line() function is:
Parameters:
- xs: This is an x-coordinates of the lines.
- ys: This is a y-coordinates of the lines.
- line_alpha: It takes the percentage value of line alpha; Its default value is 1.
- line_cap: It takes the value of line cap for the line; Its default value is butt.
- line_color: It takes the color of the line as input; Its default value is black.
- line_dash: It takes the value of line dash such as solid, dashed, dotted, dot-dash, dash-dot [Its default value is solid].
- line_dash_offset: It takes the value of line dash offset as input; Its default value is 0.
- line_join: It takes the value of line join as input; Its default value is in bevel.
- line_width: It takes the value of the width of the line as input; Its default value is 1.
- name: It takes a user-supplied name for the model as input.
- tags: It takes user-supplied values for the model as input.
Other Parameters:
- alpha: It is used for setting all alpha keyword arguments at once.
- color: It is used for setting all color keyword arguments at once.
- legend_field: It takes the name of a column as input in the data source that should be used.
- legend_group: It takes the name of a column as input in the data source that should be used.
- legend_label: It is used for labeling the legend entry.
- muted: It is used for determining whether the glyph should be rendered as muted or not; Its default value is False.
- name: It is used as an optional user-supplied name for attaching to the renderer.
- source: It is a user-supplying data source.
- view: It is used to view for filtering the data source.
- visible: It is used for determining whether the glyph should be rendered or not; Its default value is True.
- x_range_name: It is used as the name of an extra range to use for mapping x-coordinates.
- y_range_name: It is used as the name of an extra range to use for mapping y-coordinates.
- level: It is used for specifying the render level order for this glyph.
Return:
The return of multi_line() function is:
"An object of class GlyphRenderer".
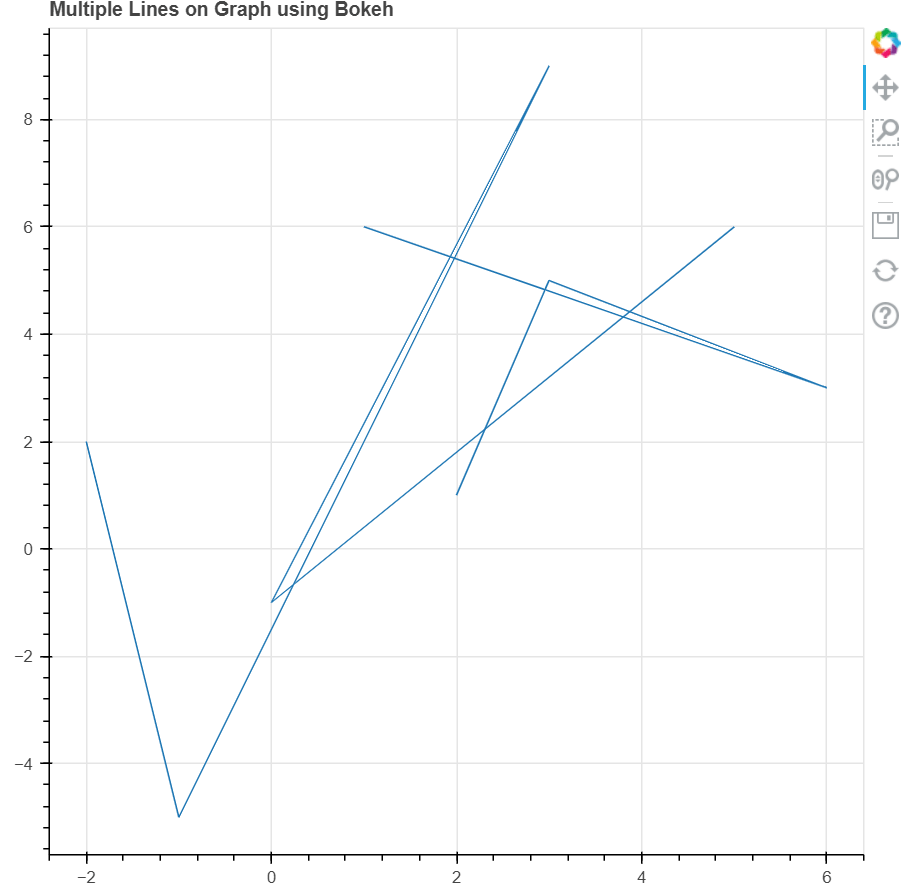
Example 1:
In this example, we will see how we can use the default values for plotting multiple lines on the graph.
Code:
Output:
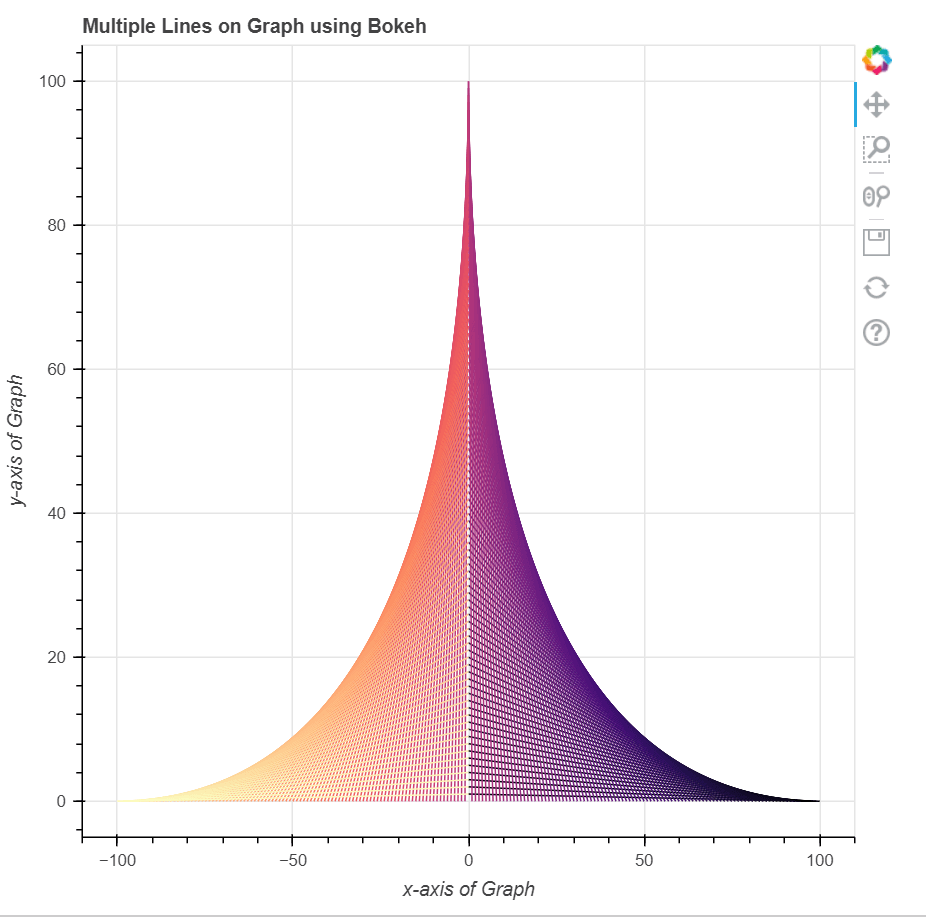
Example 2:
In this example, we will see how we can plot the multiple lines on the graph with various other parameters.
Code:
Output:
Conclusion
In this tutorial, we discussed how we can plot multiple lines on a graph using the Bokeh library in Python.
|

 For Videos Join Our Youtube Channel: Join Now


